 |
IPSDK 4.1.1.1
IPSDK : Image Processing Software Development Kit
|
This module uses Napari API [1] to visualize 3D images using the volume rendering method, but also simplification and visualization of meshes.
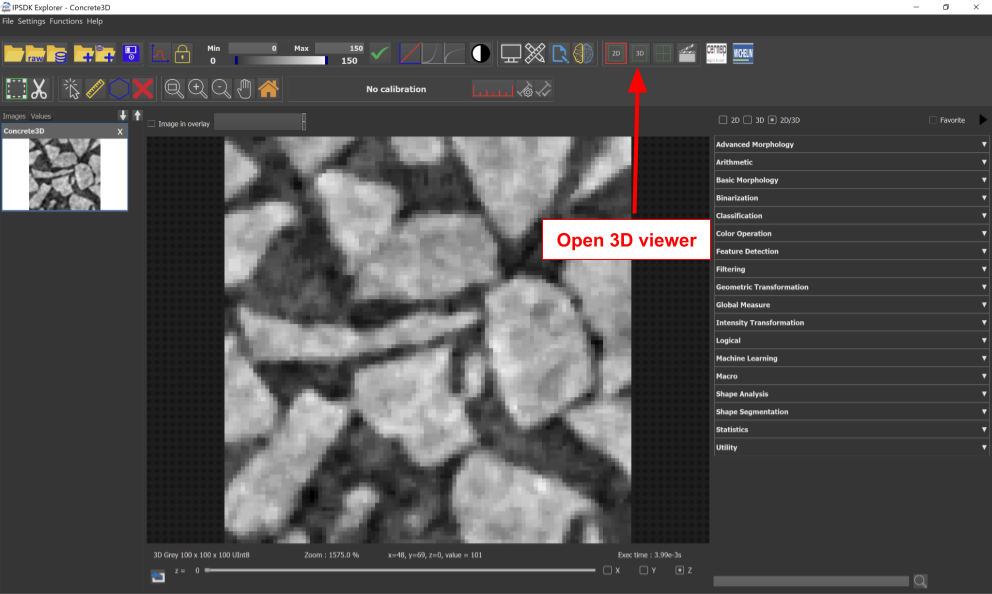
Simply start the 3D visualization of images by clicking on the 3D button.
| Keys | Interaction |
|---|---|

| Turns the camera around the volume if the camera is a Turntable camera. |
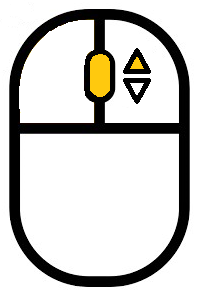
| Zooms in. |
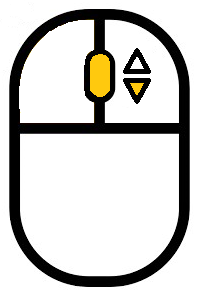
| Zooms out. |
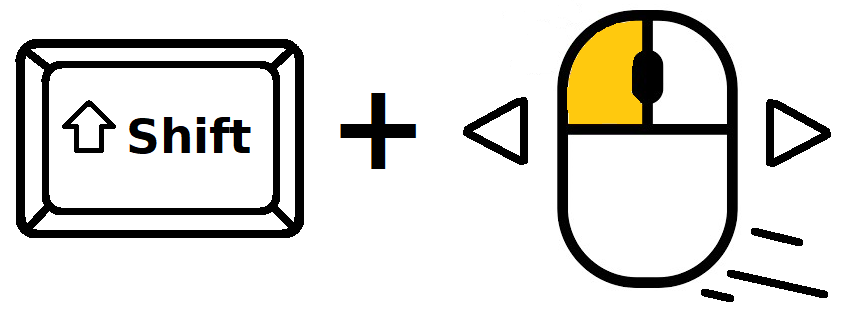
| Translates the center of the camera. |
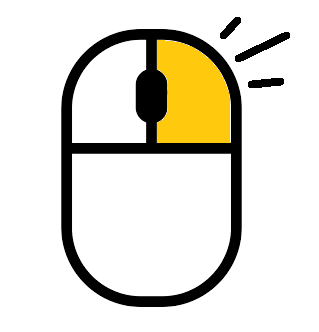
| Shows a menu with an option to copy the current 2D image displayed in the viewer to the clipboard. |
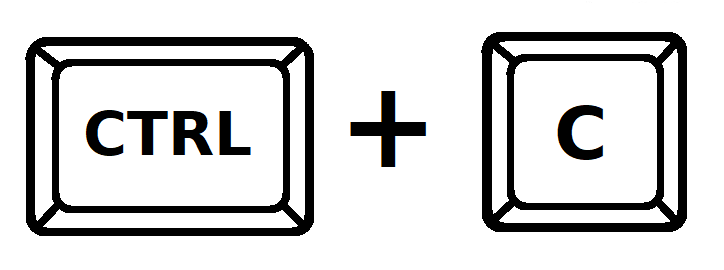
| Copies the current image displayed in the viewer to the clipboard. |

| Resets the camera position. |
Interacting with the min and max sliders will change the contrast limits. Every voxels defined at 0 will disappear.

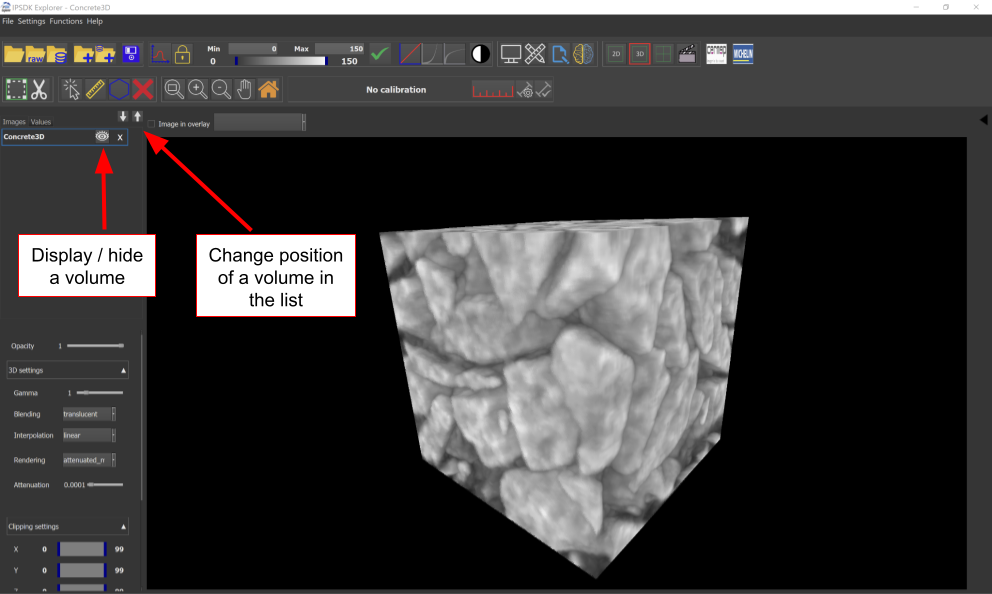
The list of images is displayed at the left of the viewer. It contains all the images imported into the software, as well as the created meshes.
Clicking on the eye button allows to show or hide a volume. It is also possible to change the position of a volume in the list using the arrows buttons above the list.
Each volume in the list is considered as a layer in the viewer with a position defined when the volume is imported. The position of a layer in the list influences the visualization of the other volumes in the viewer. The last imported volume will automatically be placed on top of the other layers.
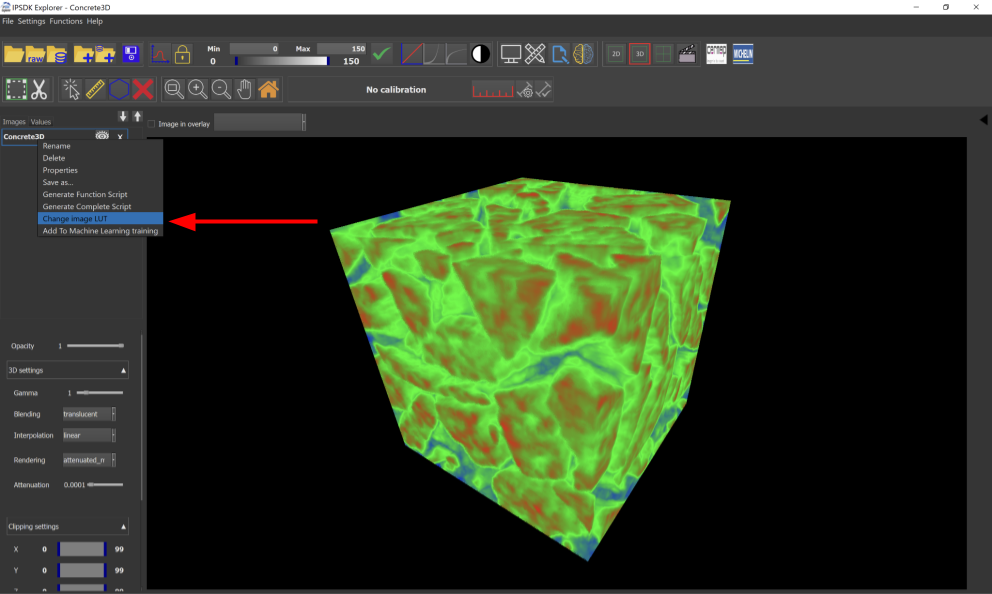
It is also possible to change the colormap of a volume by right clicking on the image name in the list and selecting the "change image LUT" option.

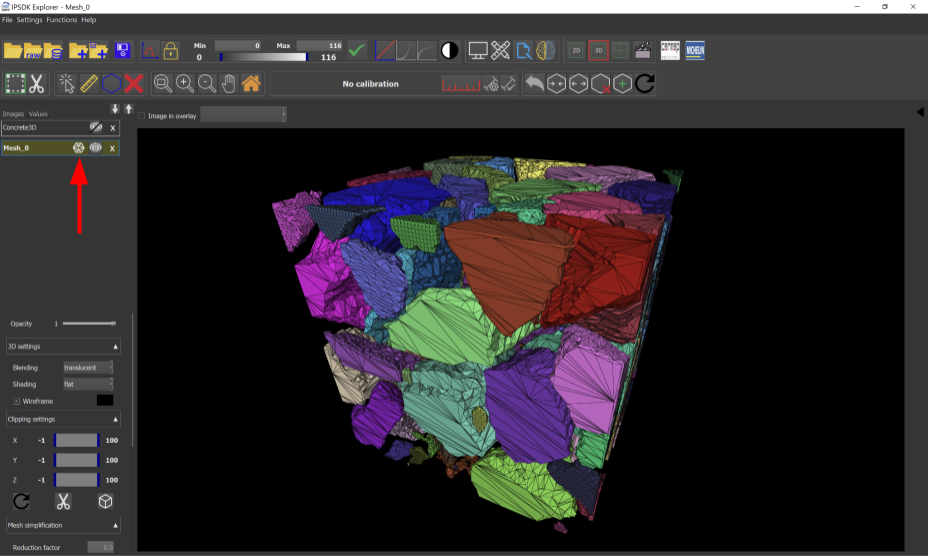
There are several settings that allows to change the visualization of imported volumes. It is important to know how they work to choose the best configuration for visualizing data. The 3D viewer offers 5 differents settings for the volume rendering.
The Opacity setting allows to adjust the volume opacity. Its value varies between 0, fully invisible, and 1, fully visible.
The Gamma setting allows to adjust the gamma correction. Its value varies between 0 and 5.
The Blending setting allows to determine how the visuals of a volume get mixed with the ones from other volumes. There are 5 different modes.
| Mode | Description | Example |
|---|---|---|
| Translucent | Blends the volume with the volumes below it if decreasing its opacity but will fully block those volumes if its opacity is 1. This is a reasonable default, useful for many applications | 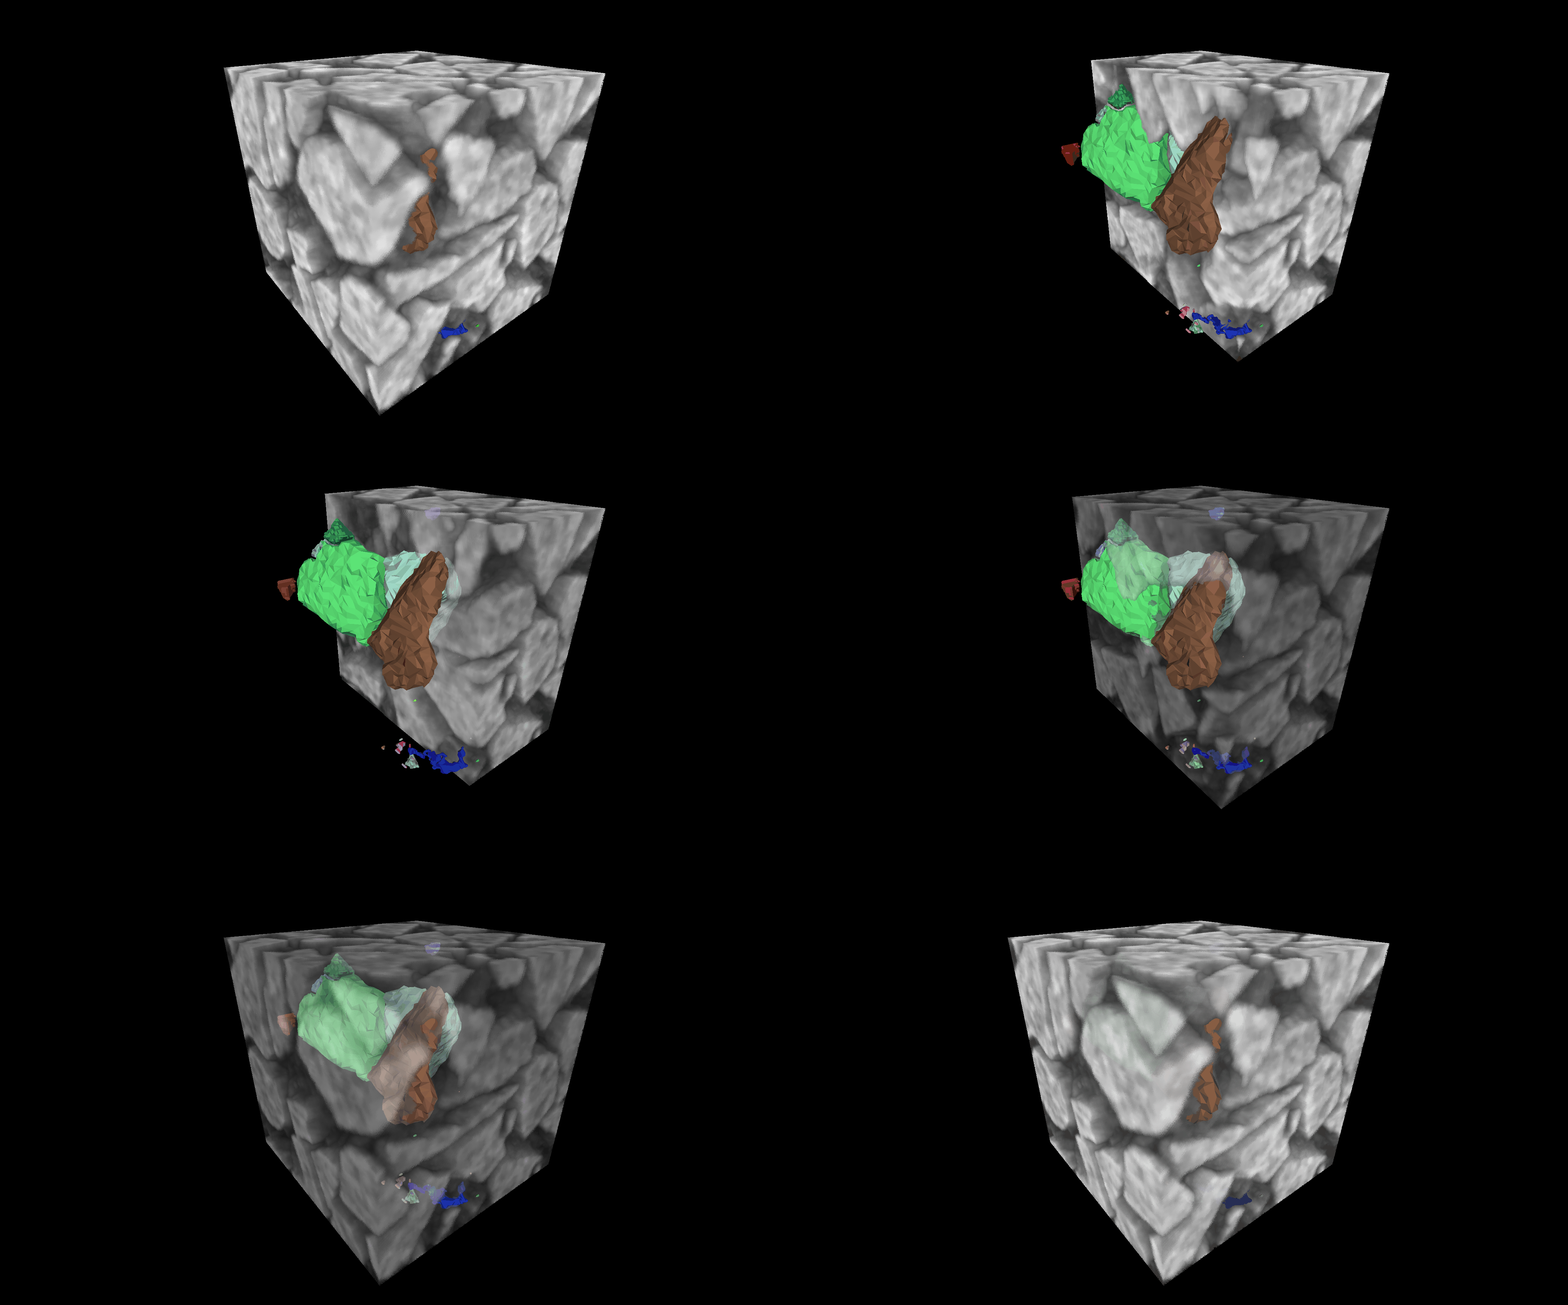
|
| Transclucent no depth | Allows multiple volumes to be blended with different opacity, but no depth testing is performed. | 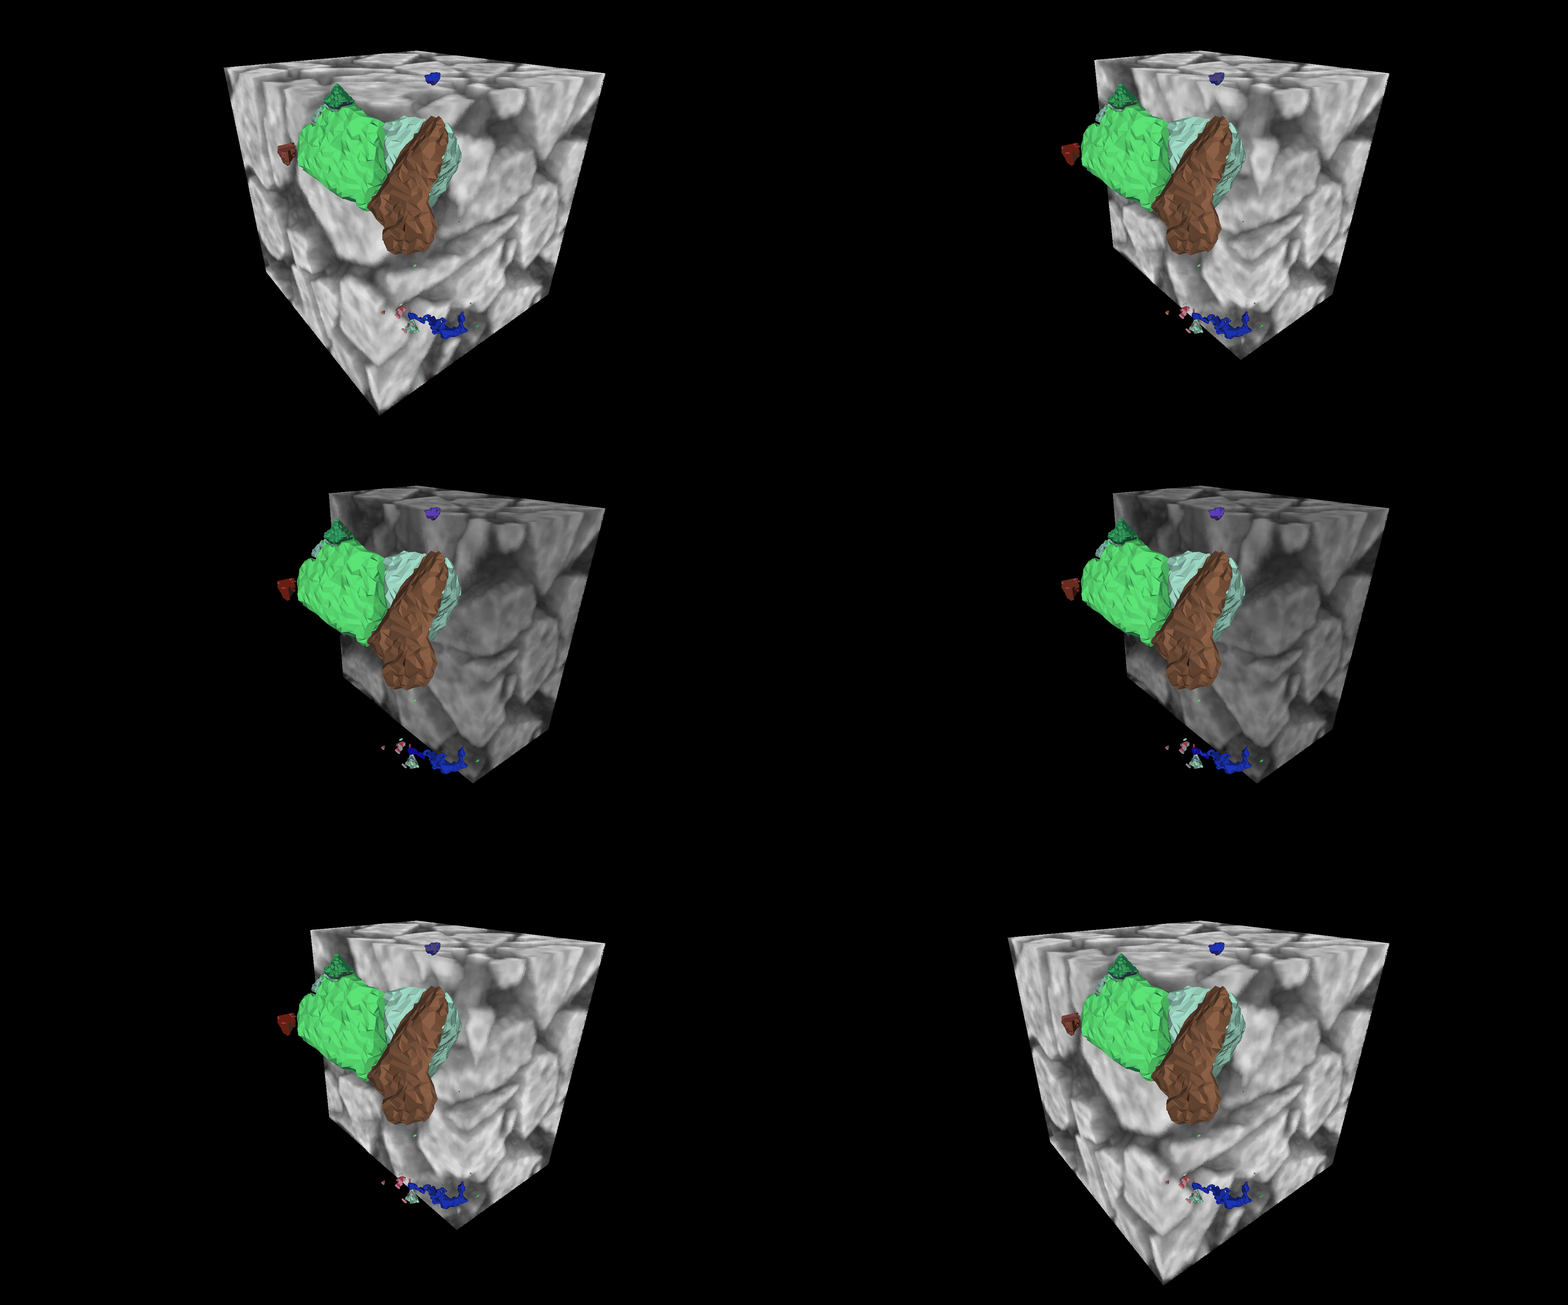
|
| Additive | Blends the volume with the volumes below even when it has full opacity. This mode is especially useful for visualizing multiple volumes at the same time. | 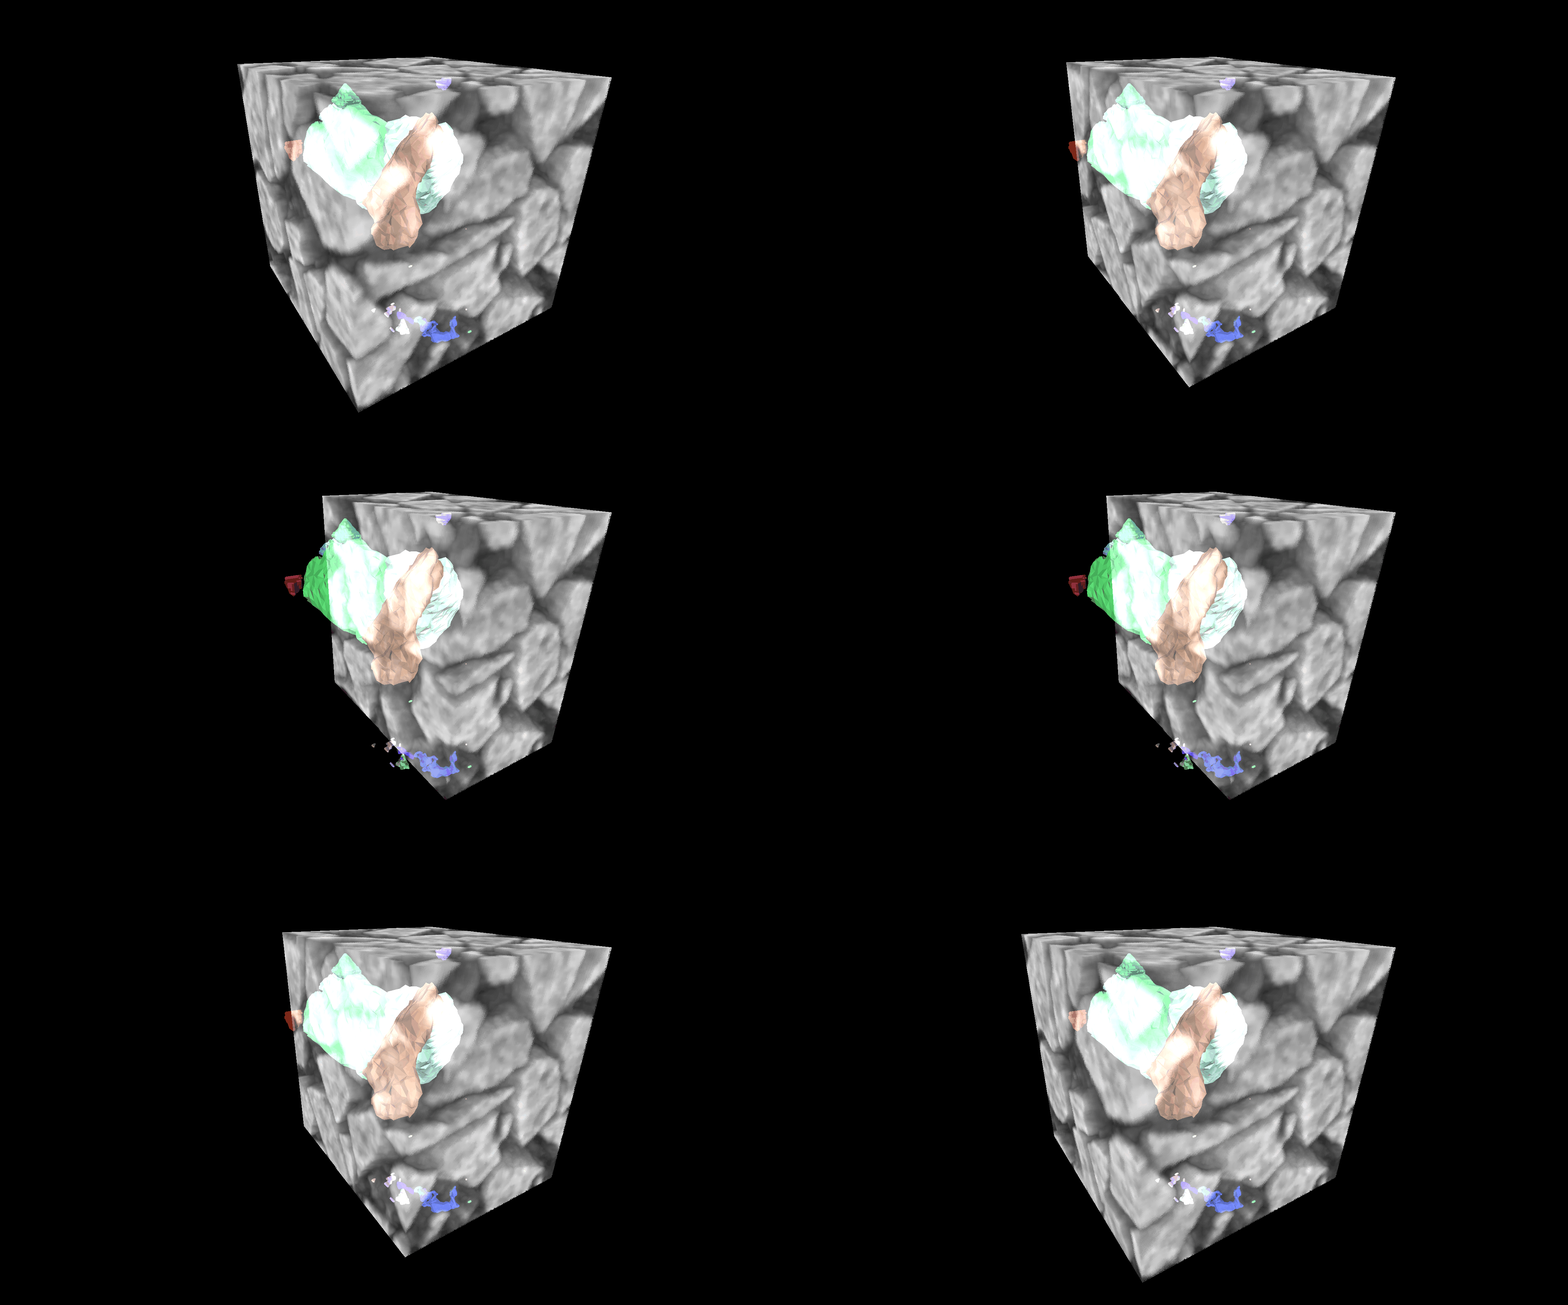
|
| Minimum | Blends the volume using the minimum of each pixel is R, G, and B values. This mode is useful for blending multiple volumes with inverted colormaps/LUTs. | 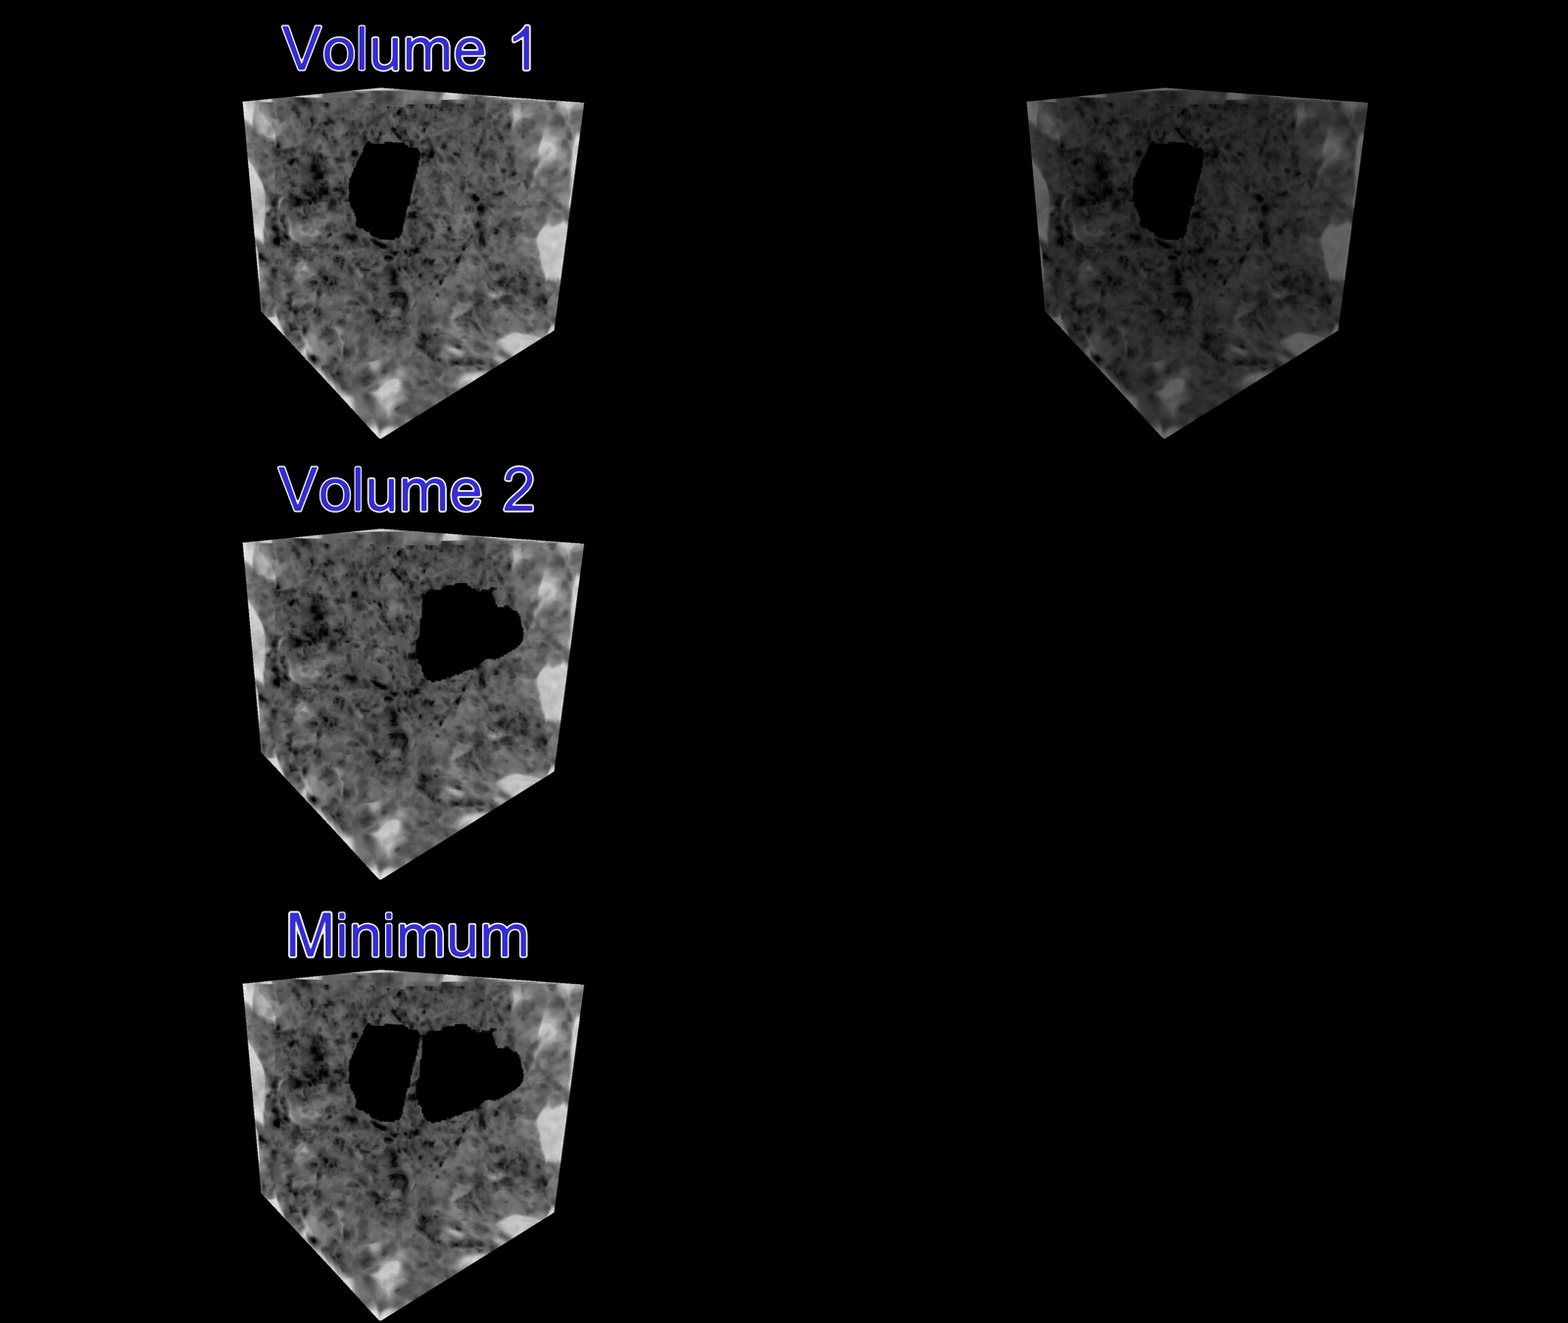
|
| Opaque | Defines the opacity at 1 by default and hides any volumes data below a volume. | 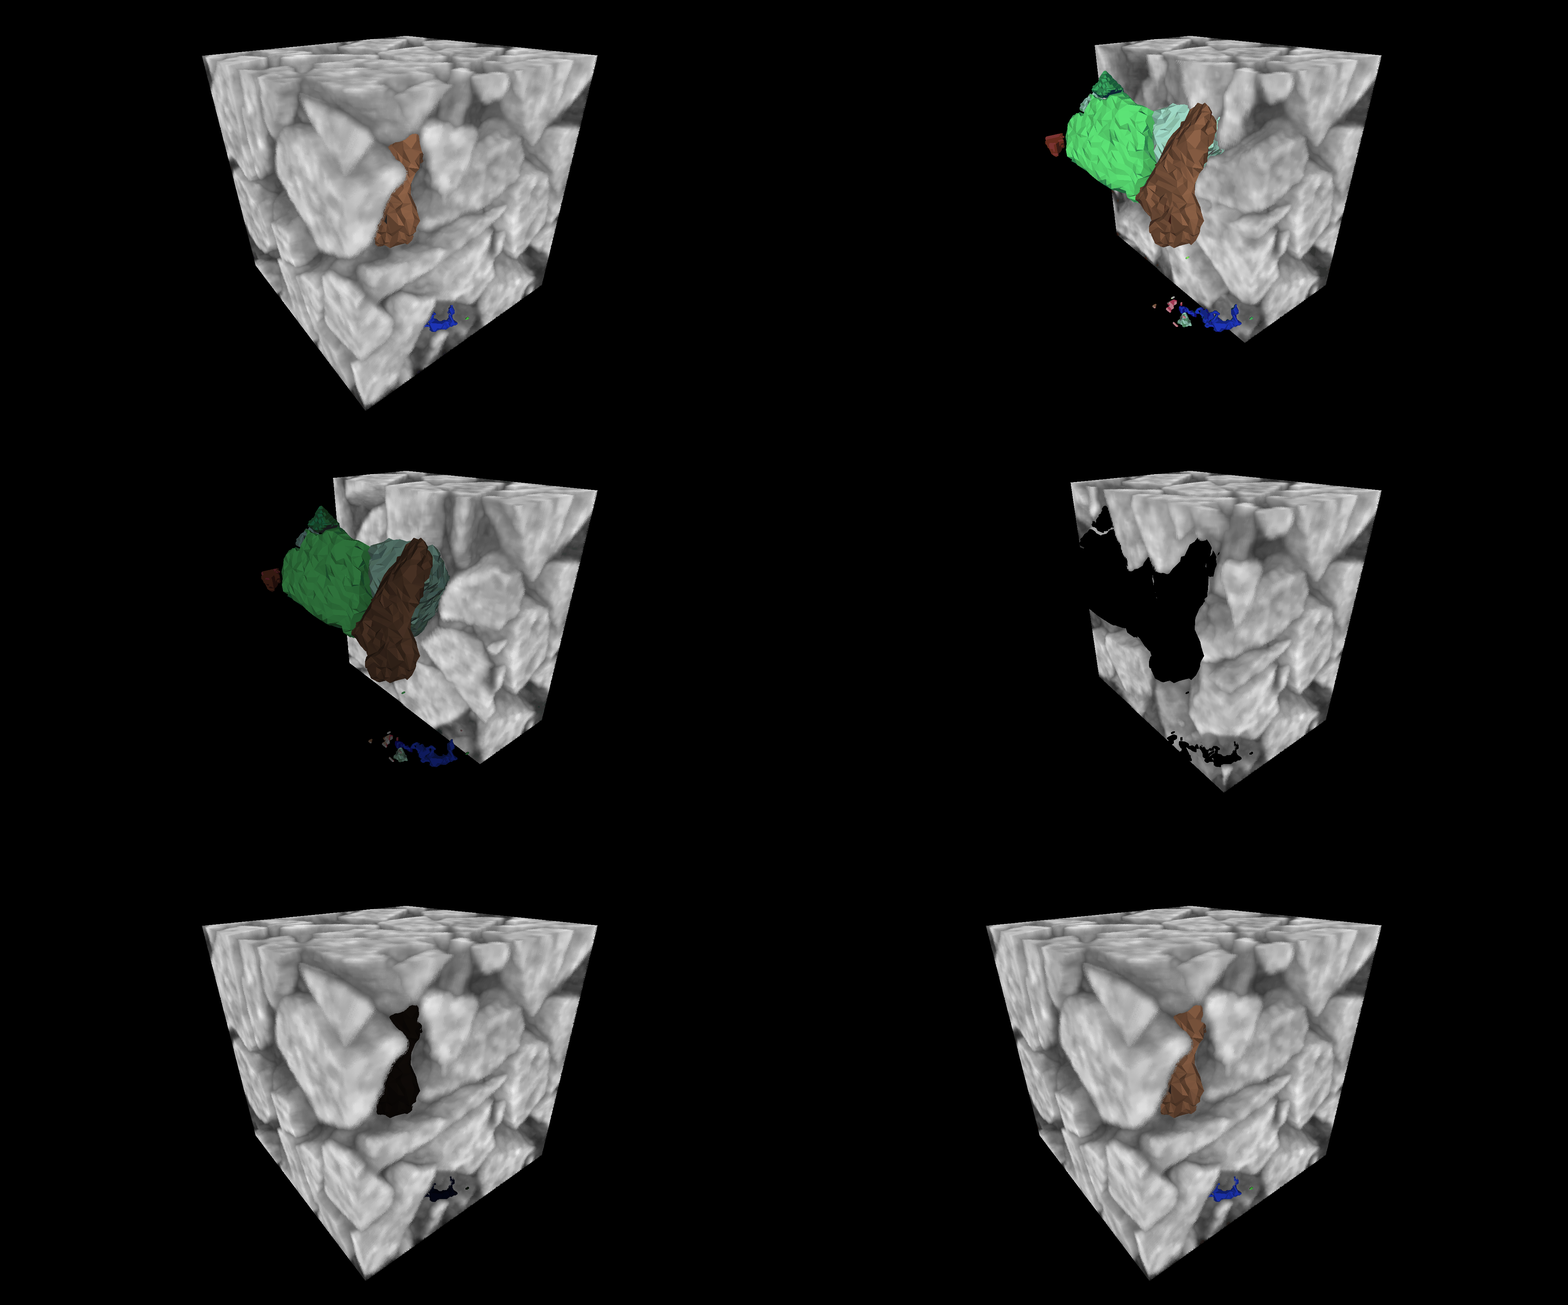
|
The Interpolation setting allows to visualize volume data with different types of interpolation. Four differents interpolations are available : nearest [2], linear [3], bicubic [4], kaiser [5].
Here is an example below of the different interpolation modes.
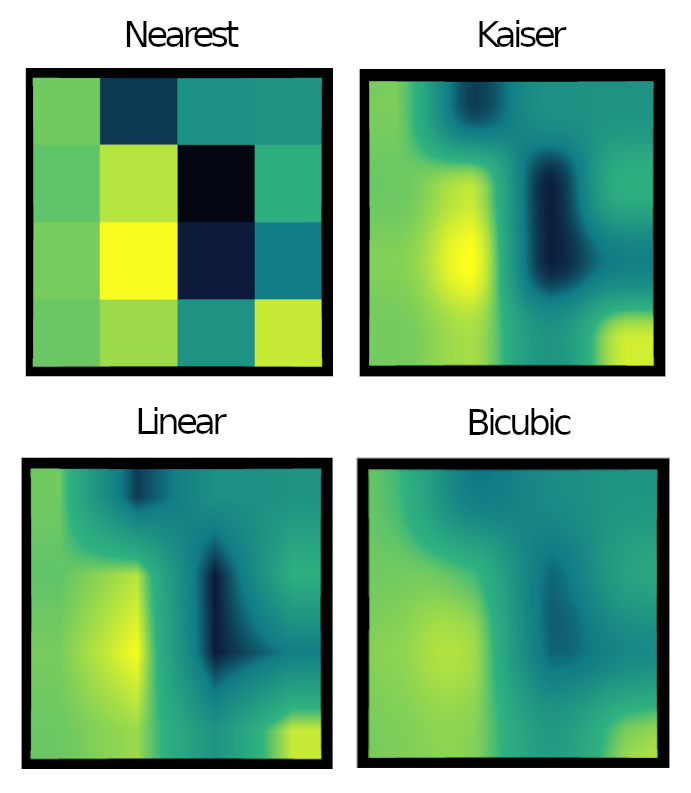
The Rendering setting determines how the volume is displayed. See the seven modes provided below.
| Mode | Description | Example |
|---|---|---|
| Translucent | Voxel colors are blended along the view ray until the result is opaque. | 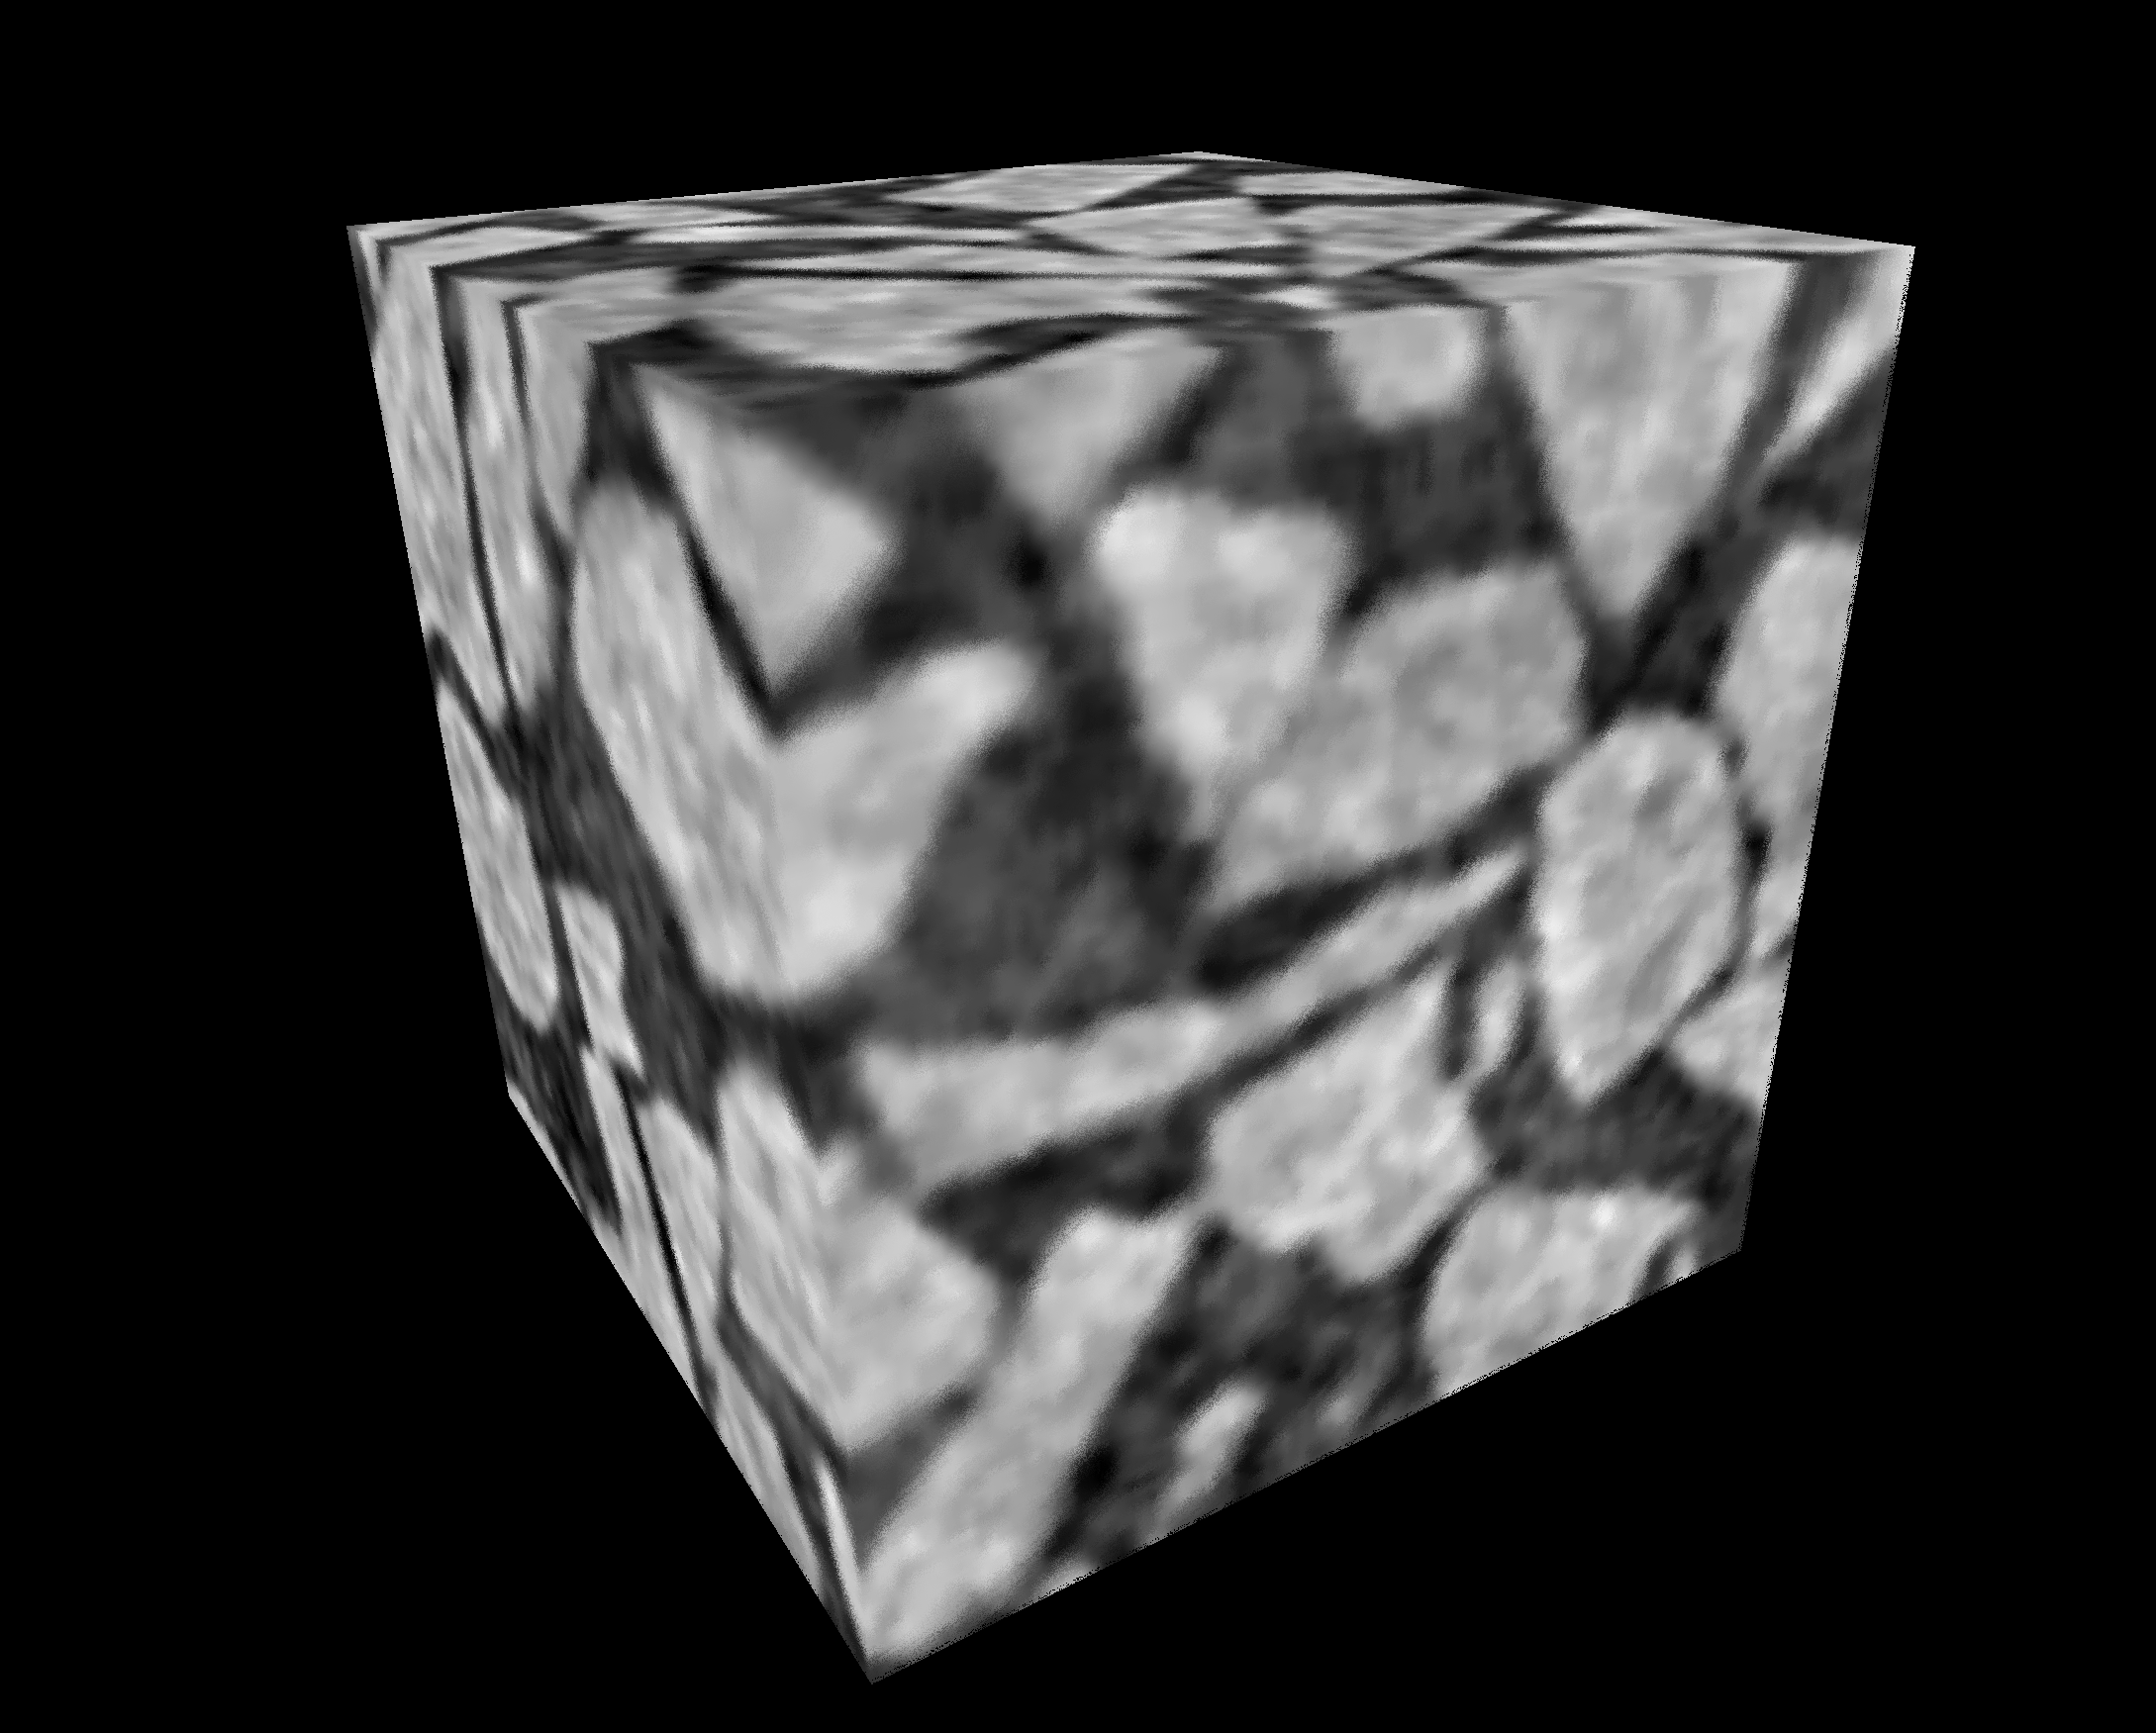
|
| Additive | Voxel colors are added along the view ray until the result is saturated. | 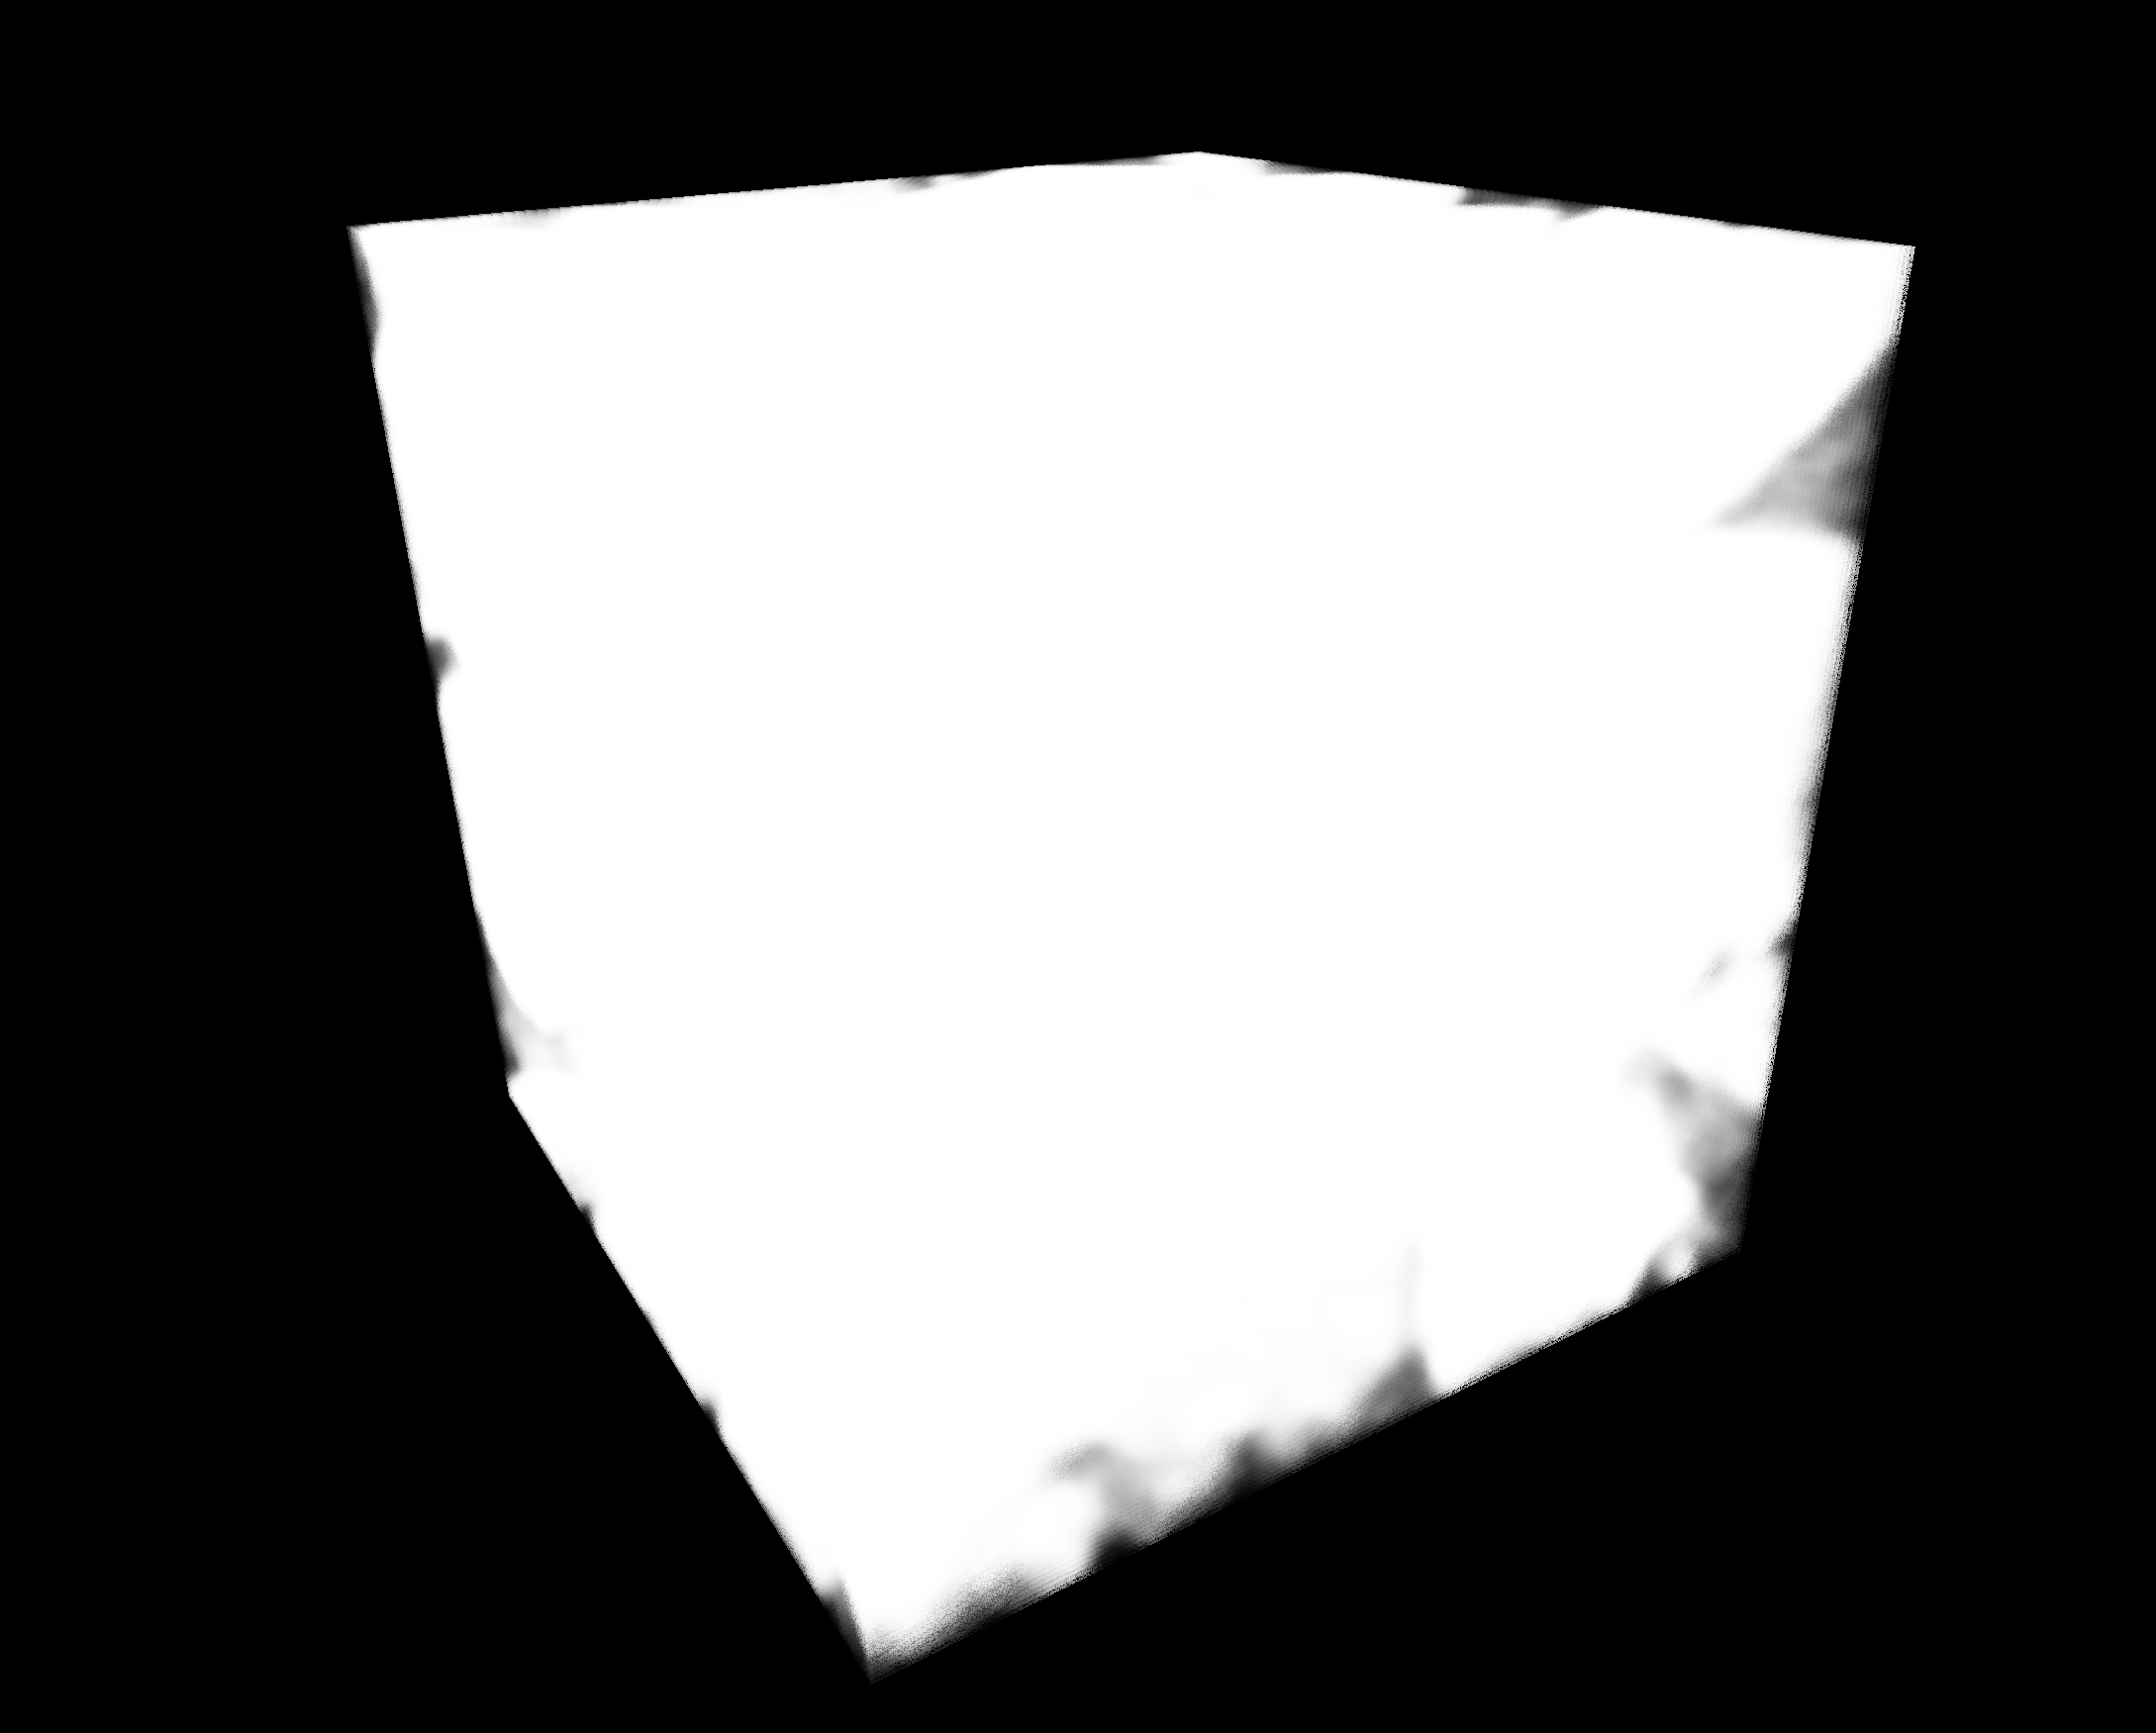
|
| Iso | Isosurface. Cast a ray until a certain threshold is encountered. At that location, lightning calculations are performed to give the visual appearance of a surface. | 
|
| Mip | Maximum intensity projection. Cast a ray and display the maximum value that was encountered. | 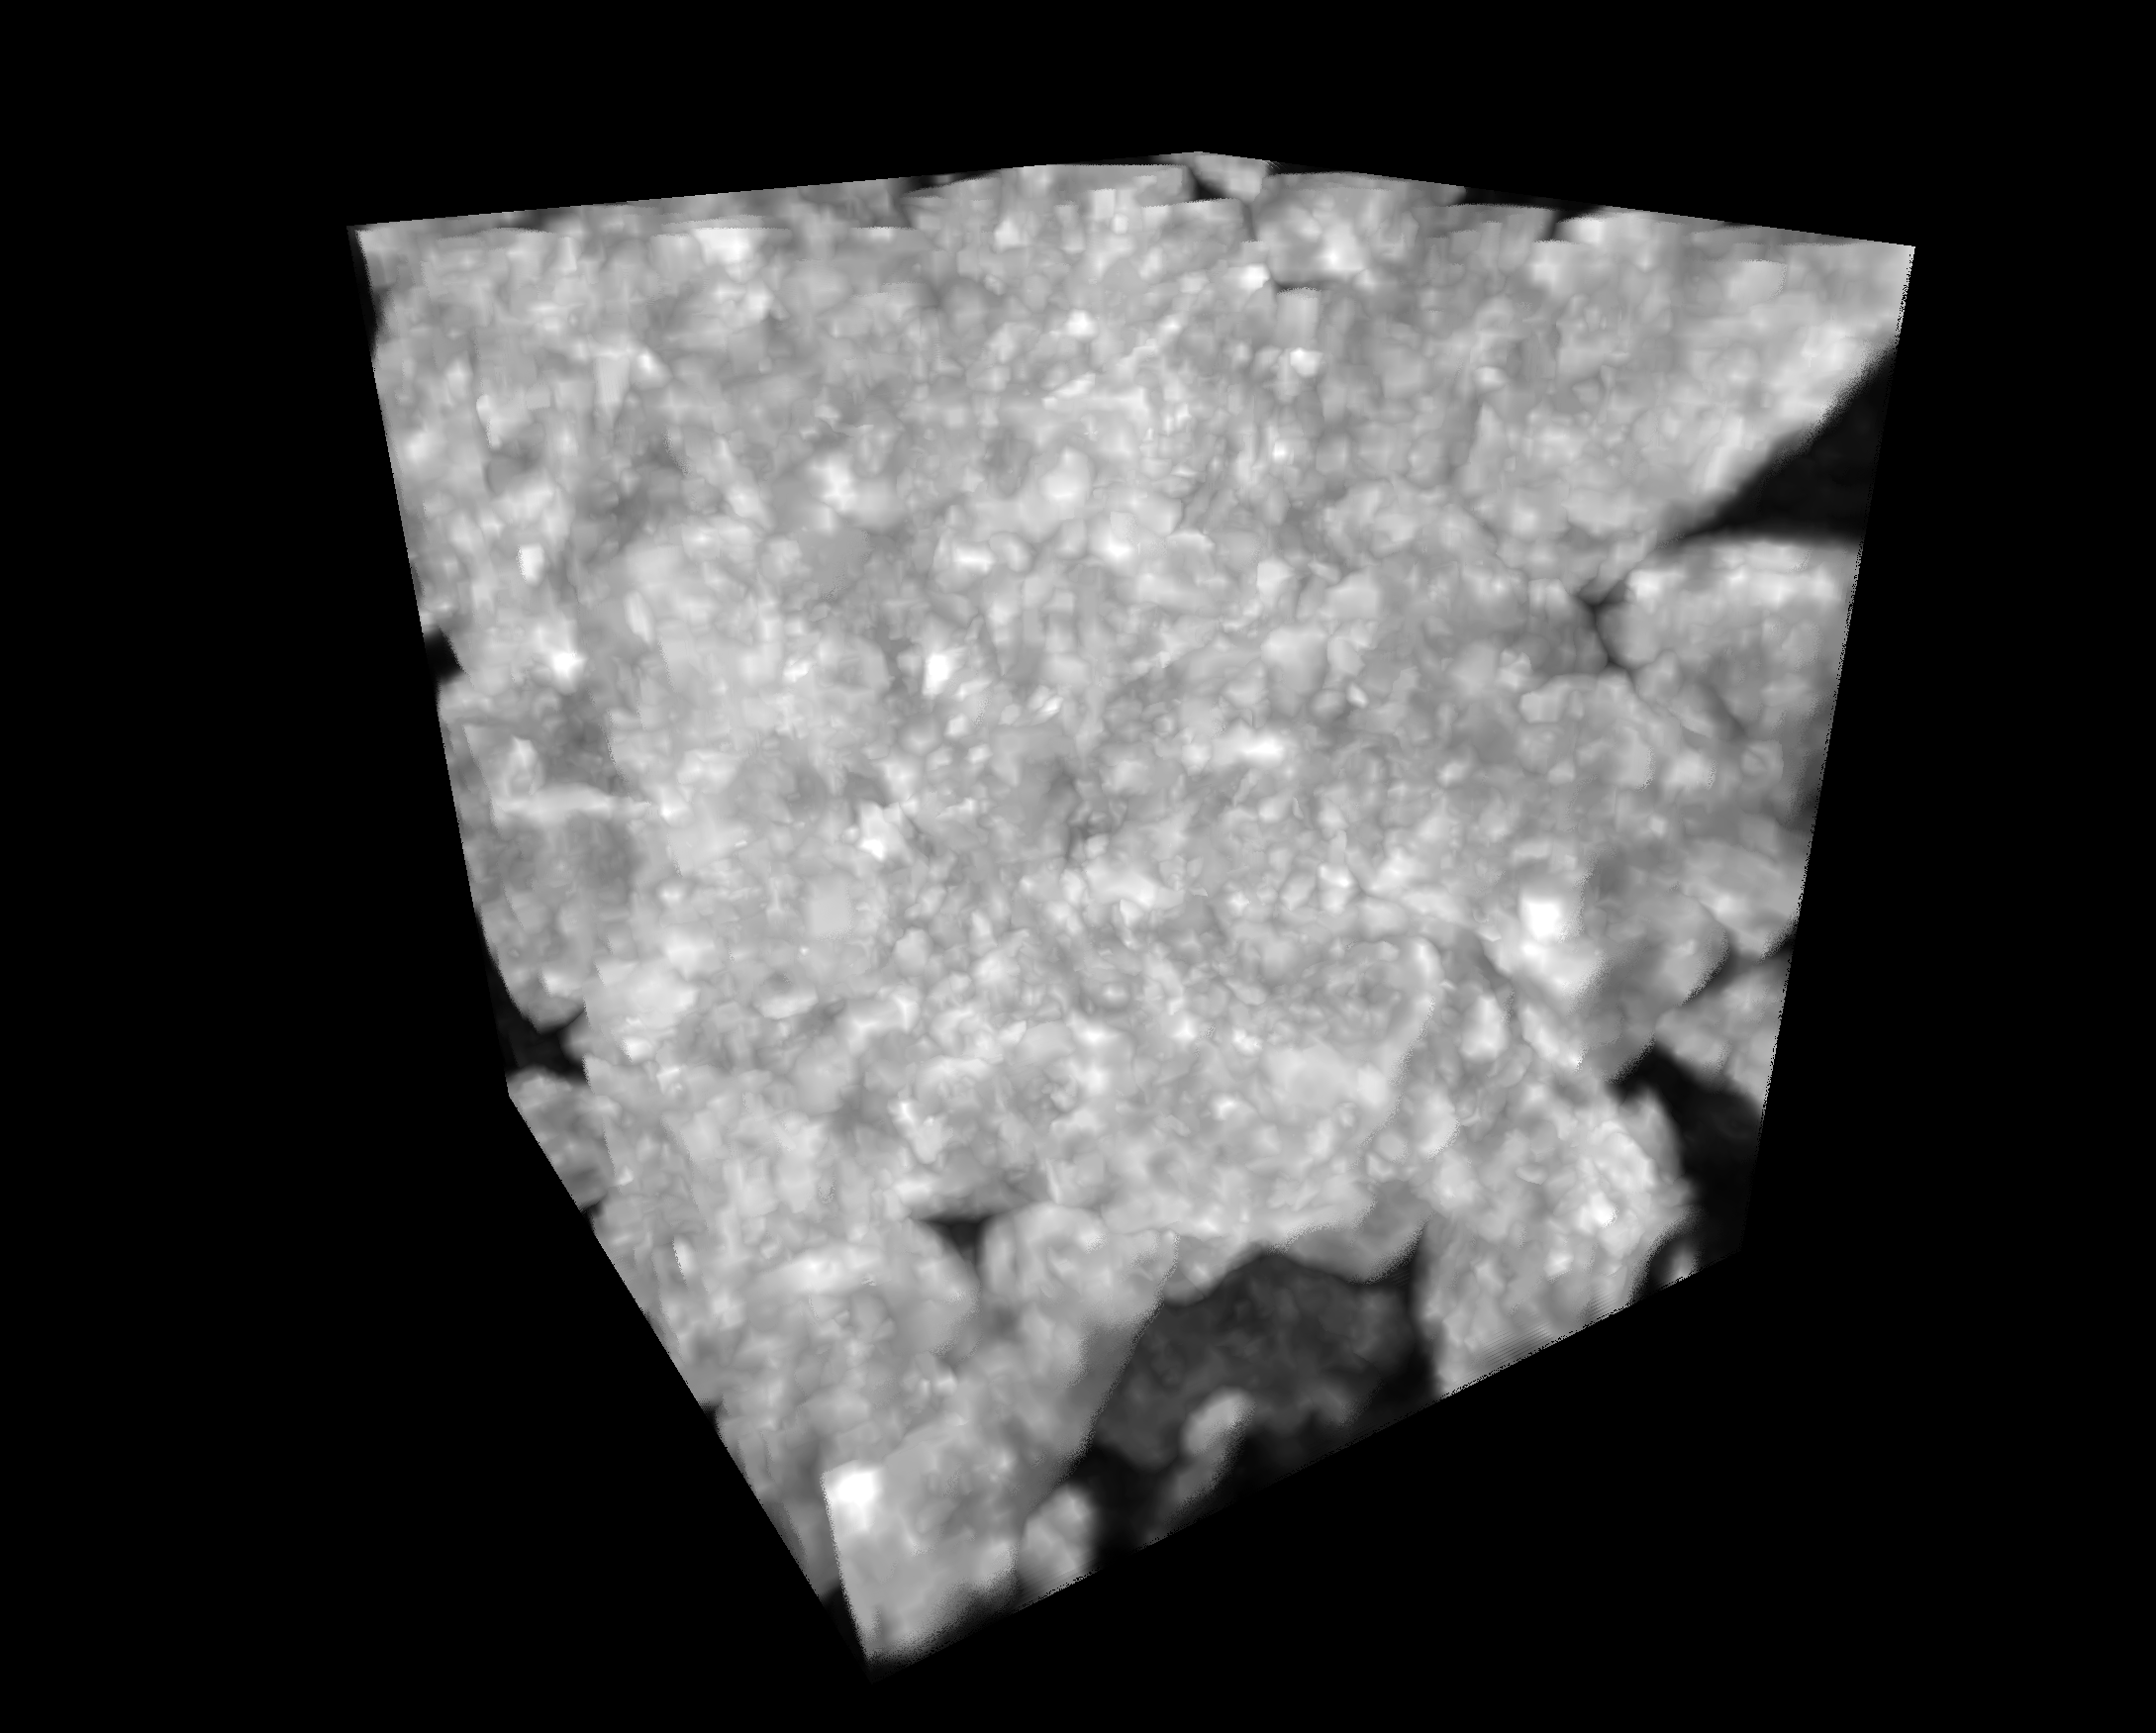
|
| Minip | Minimum intensity projection. Cast a ray and display the minimum value that was encountered. | 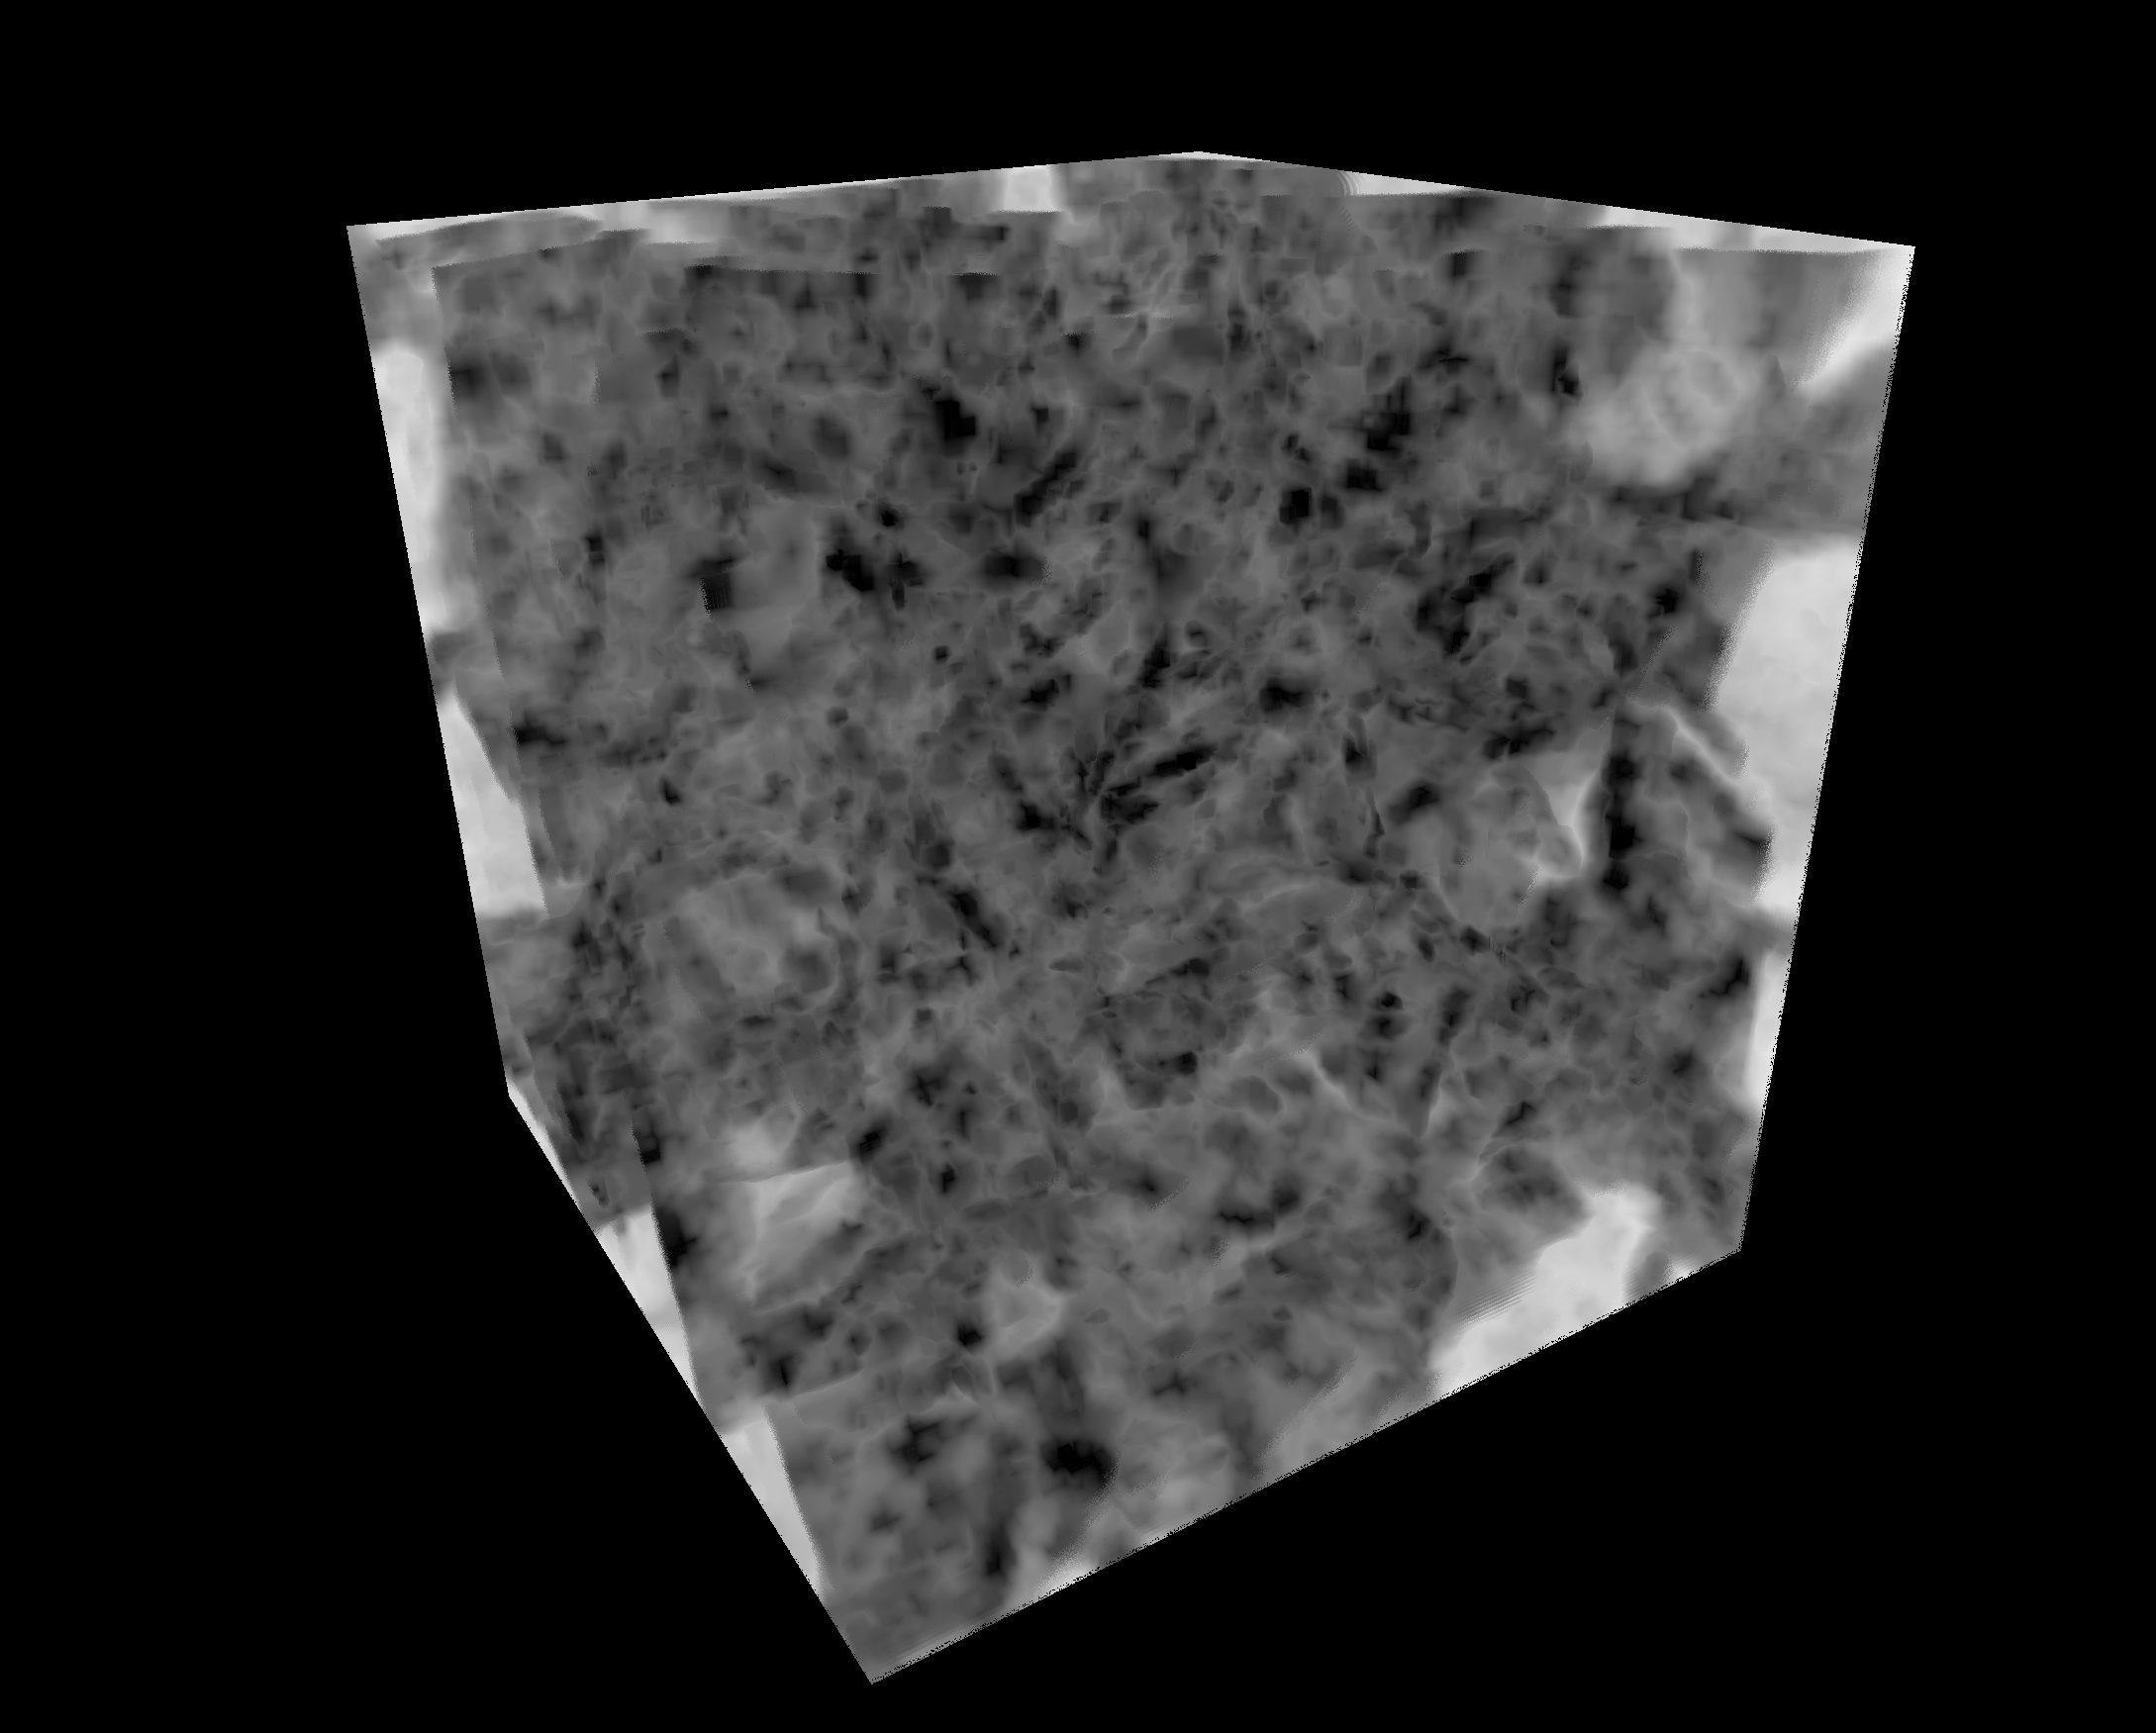
|
| Attenuated mip | Attenuated maximum intensity projection. Cast a ray and attenuate values based on integral of encountered values, display the maximum value that was encountered after attenuation. This will make closer objects appear more prominent. | 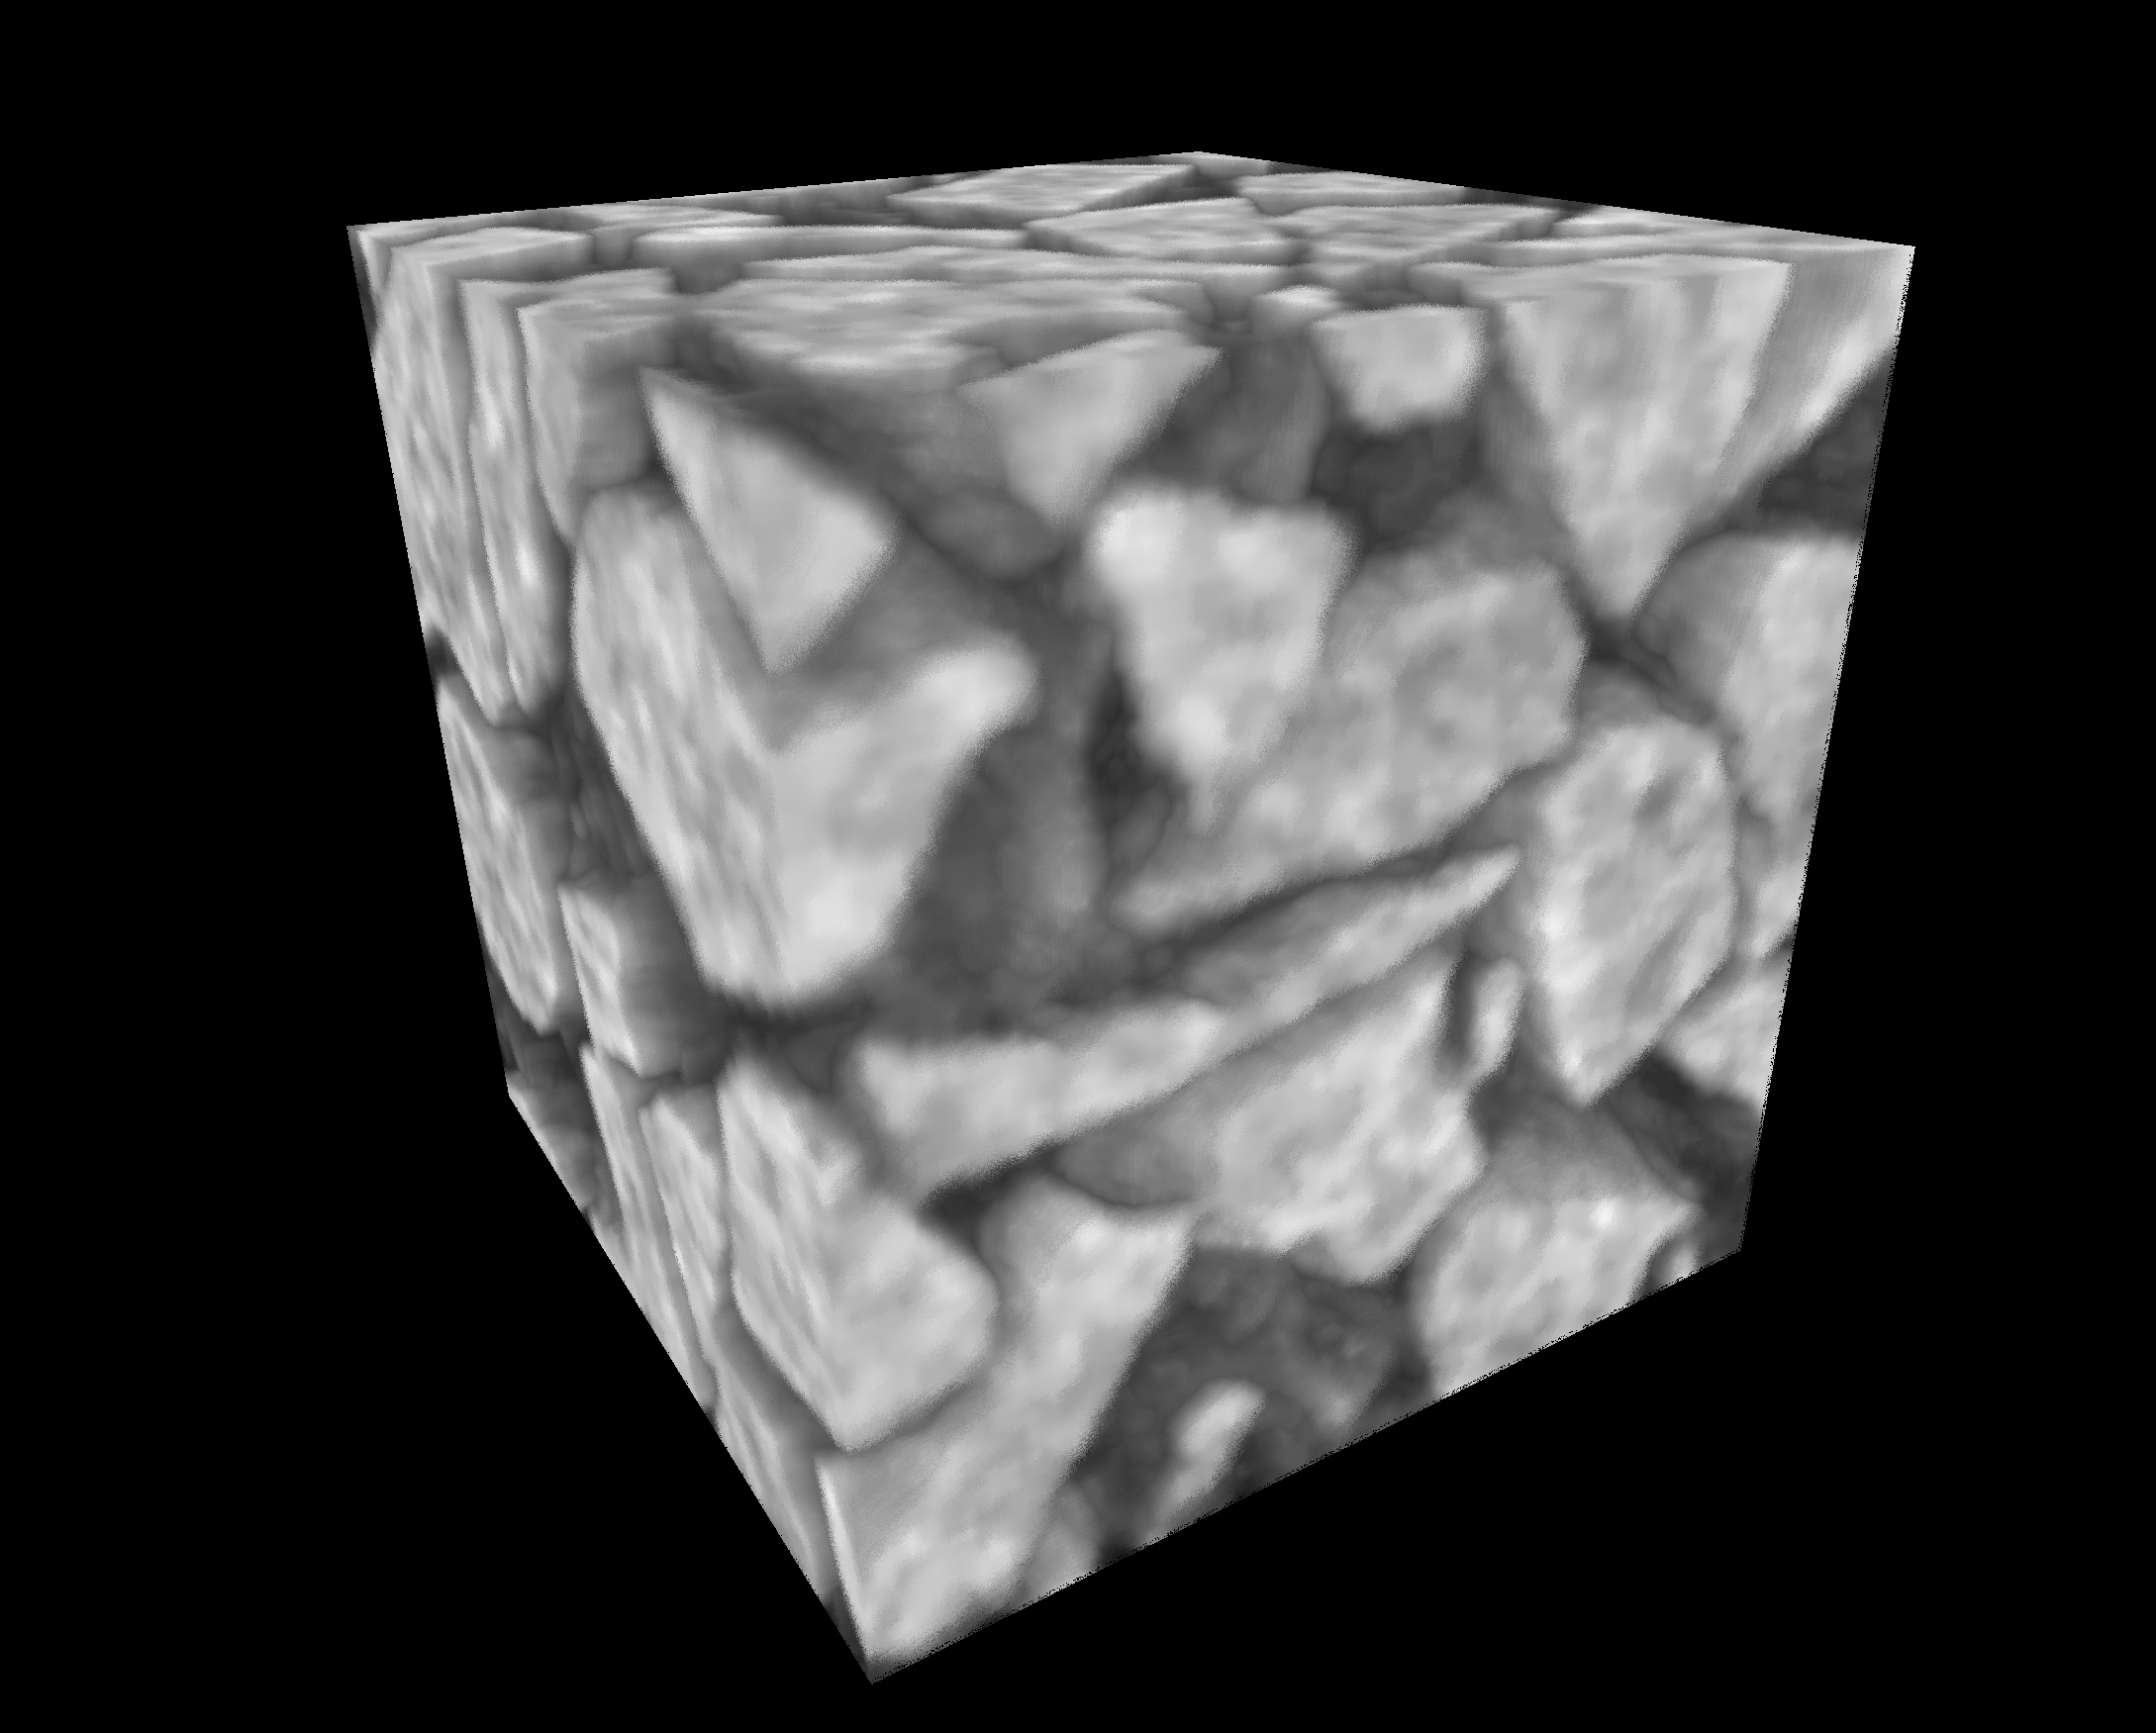
|
| Average | Average intensity projection. Cast a ray and display the average value that was encountered. | 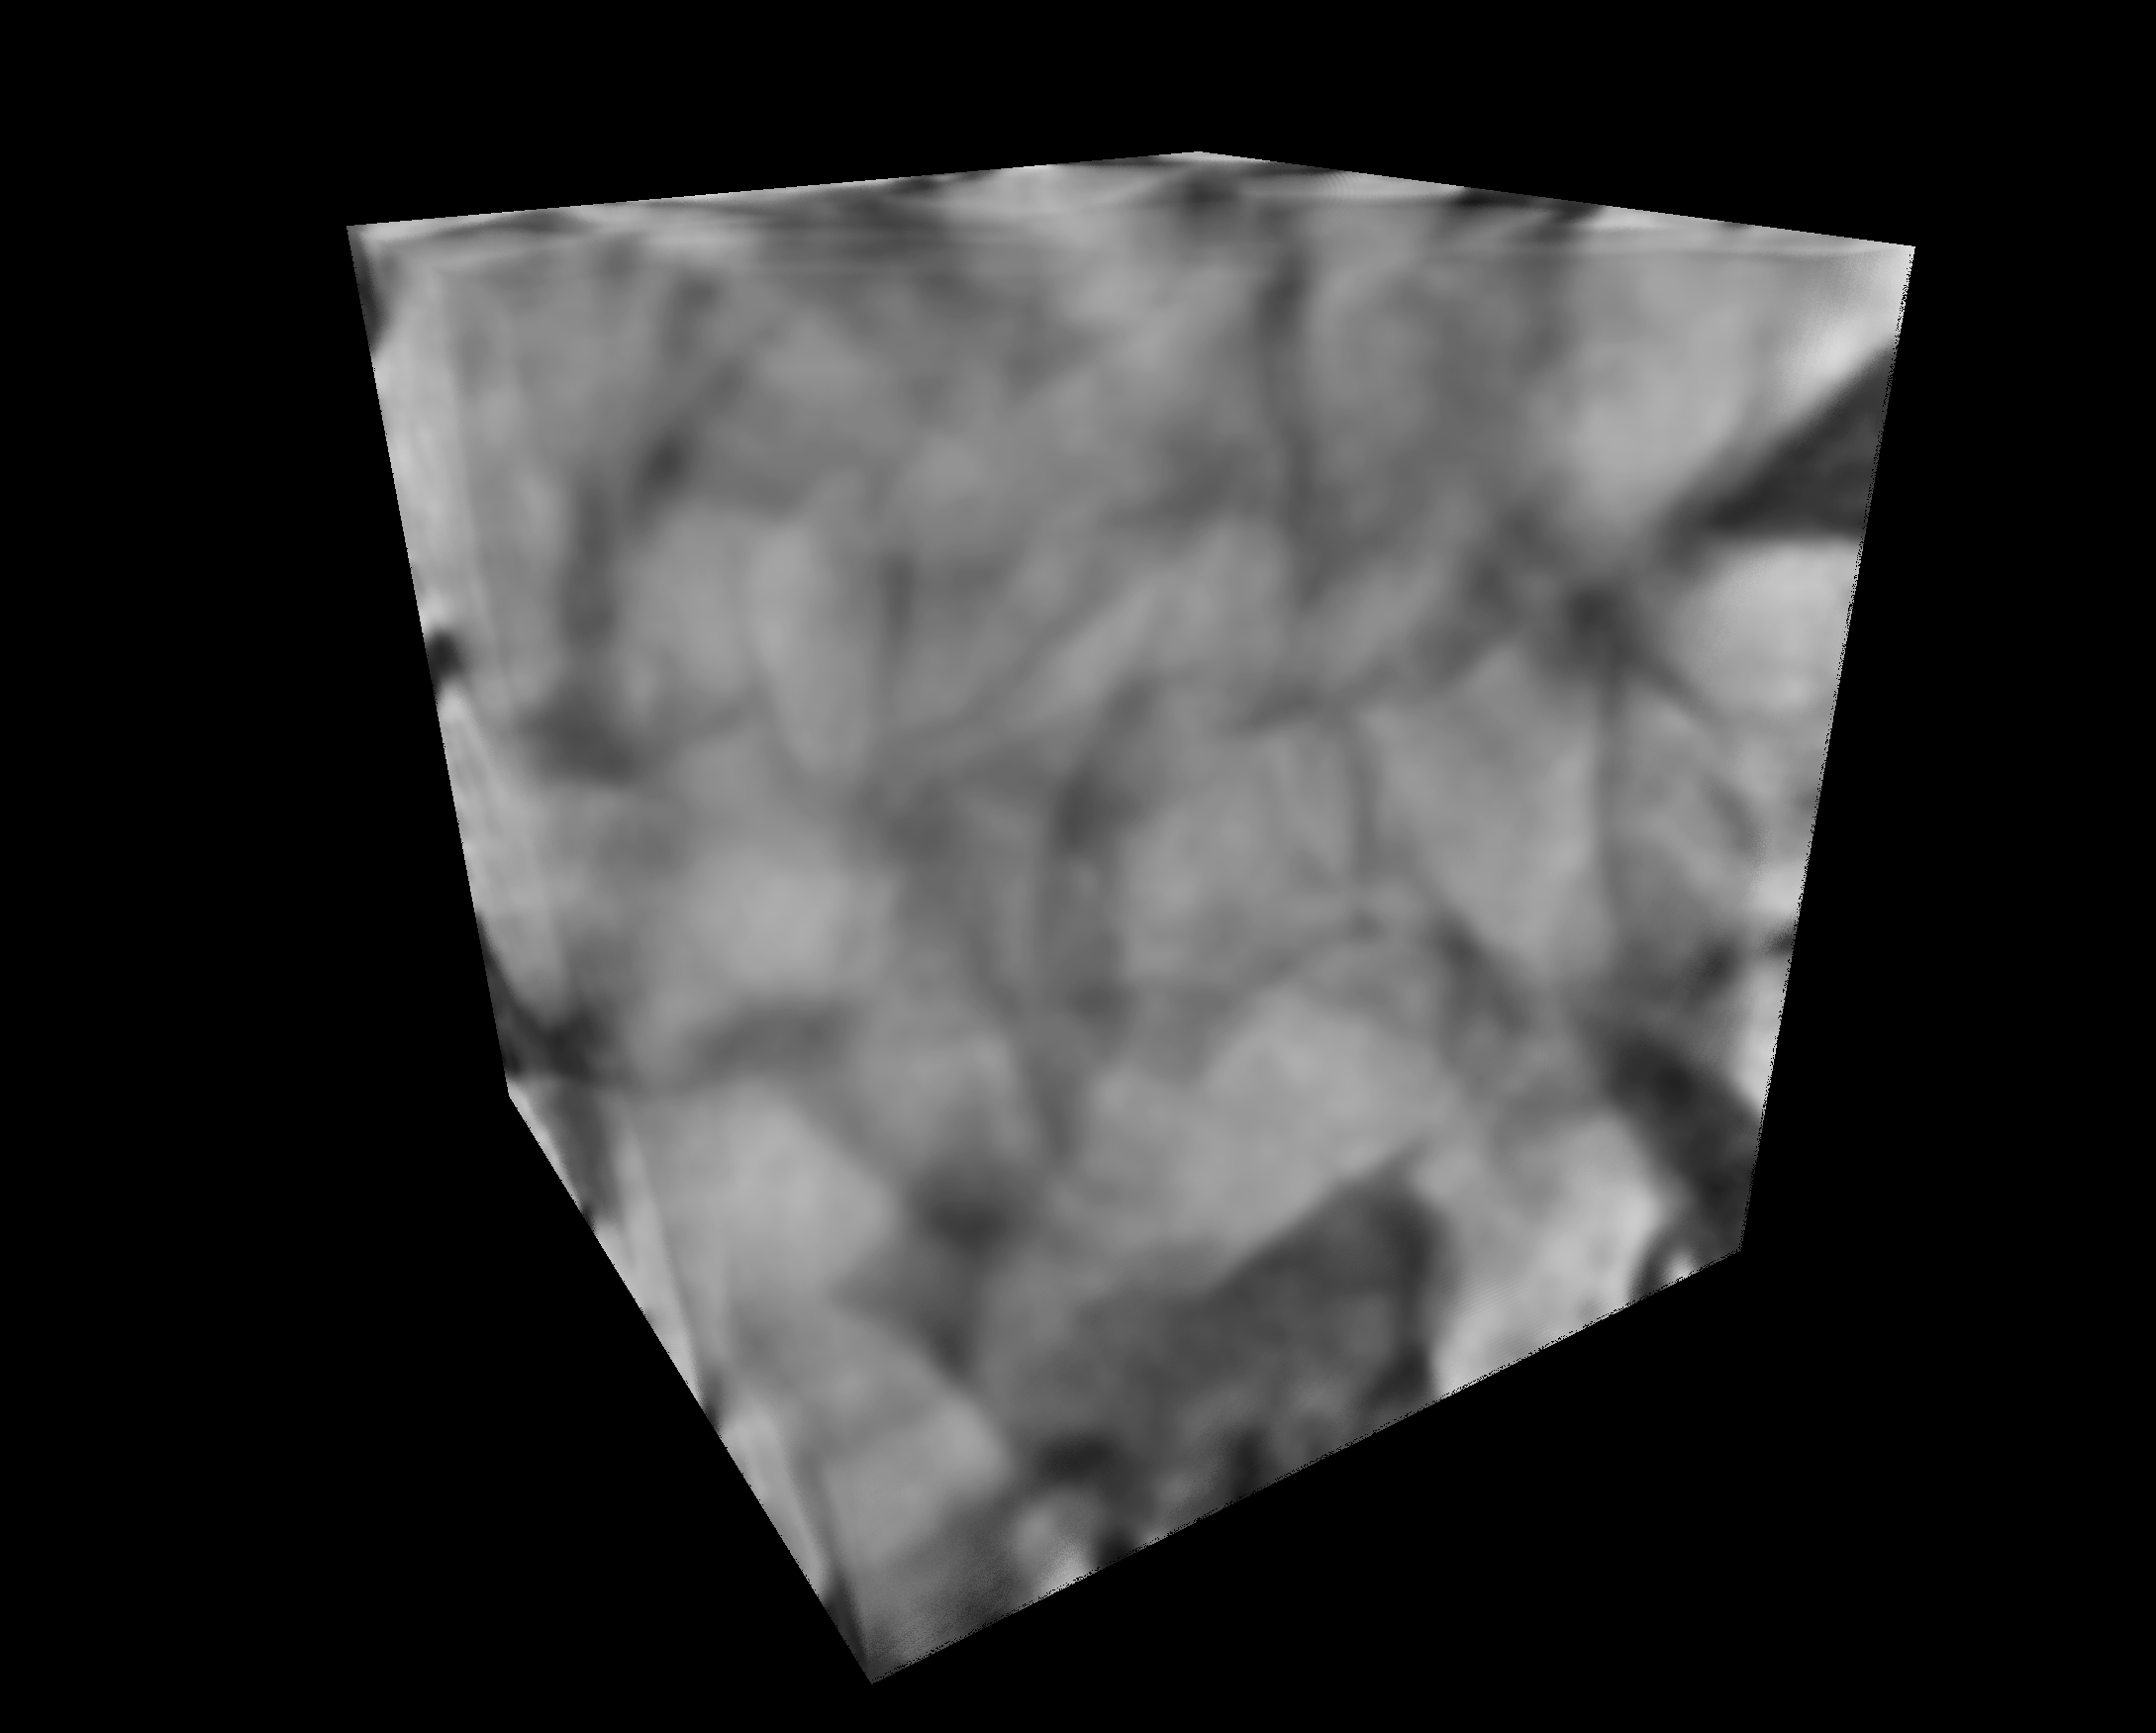
|
Like the volume rendering there are different types of settings to change the visualization of meshes.
The Opacity setting allows to adjust the mesh opacity. Its value varies between 0, fully invisible and 1, fully visible.
The Blending setting allows to determine how the visuals of a mesh get mixed with the ones from other volumes and meshes. The blending modes are the same as described in the volume rendering settings section.
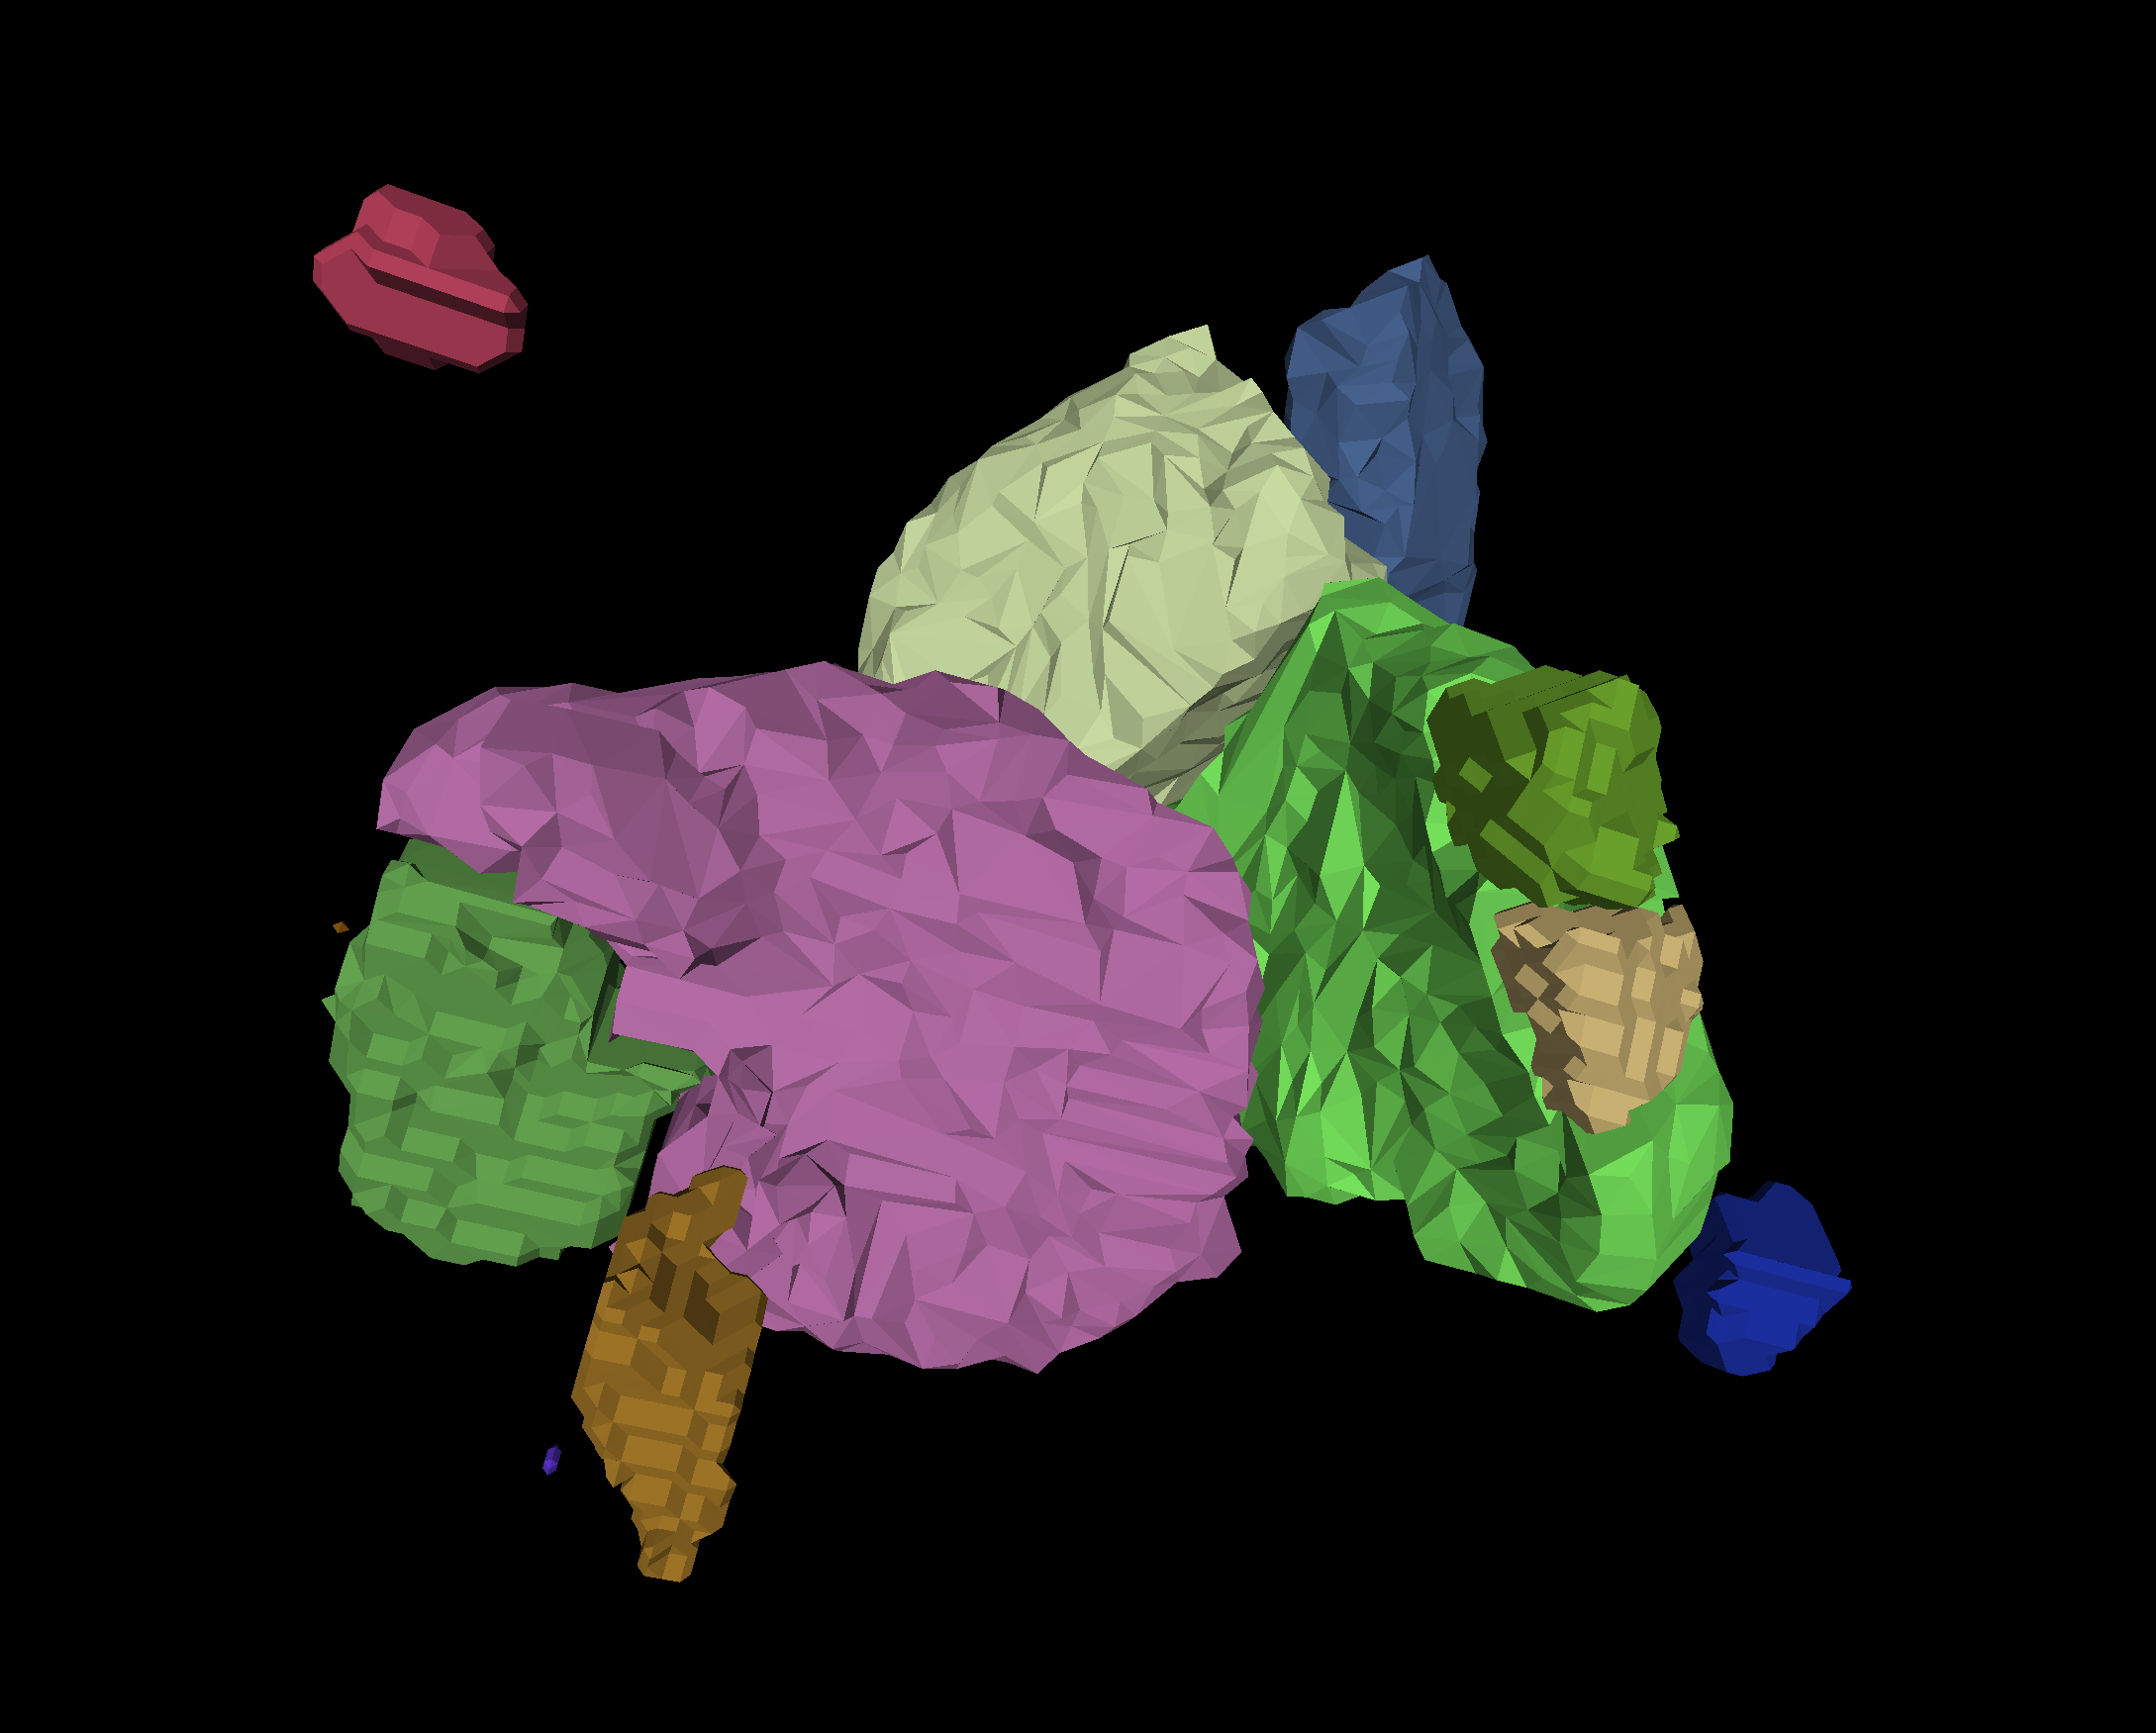
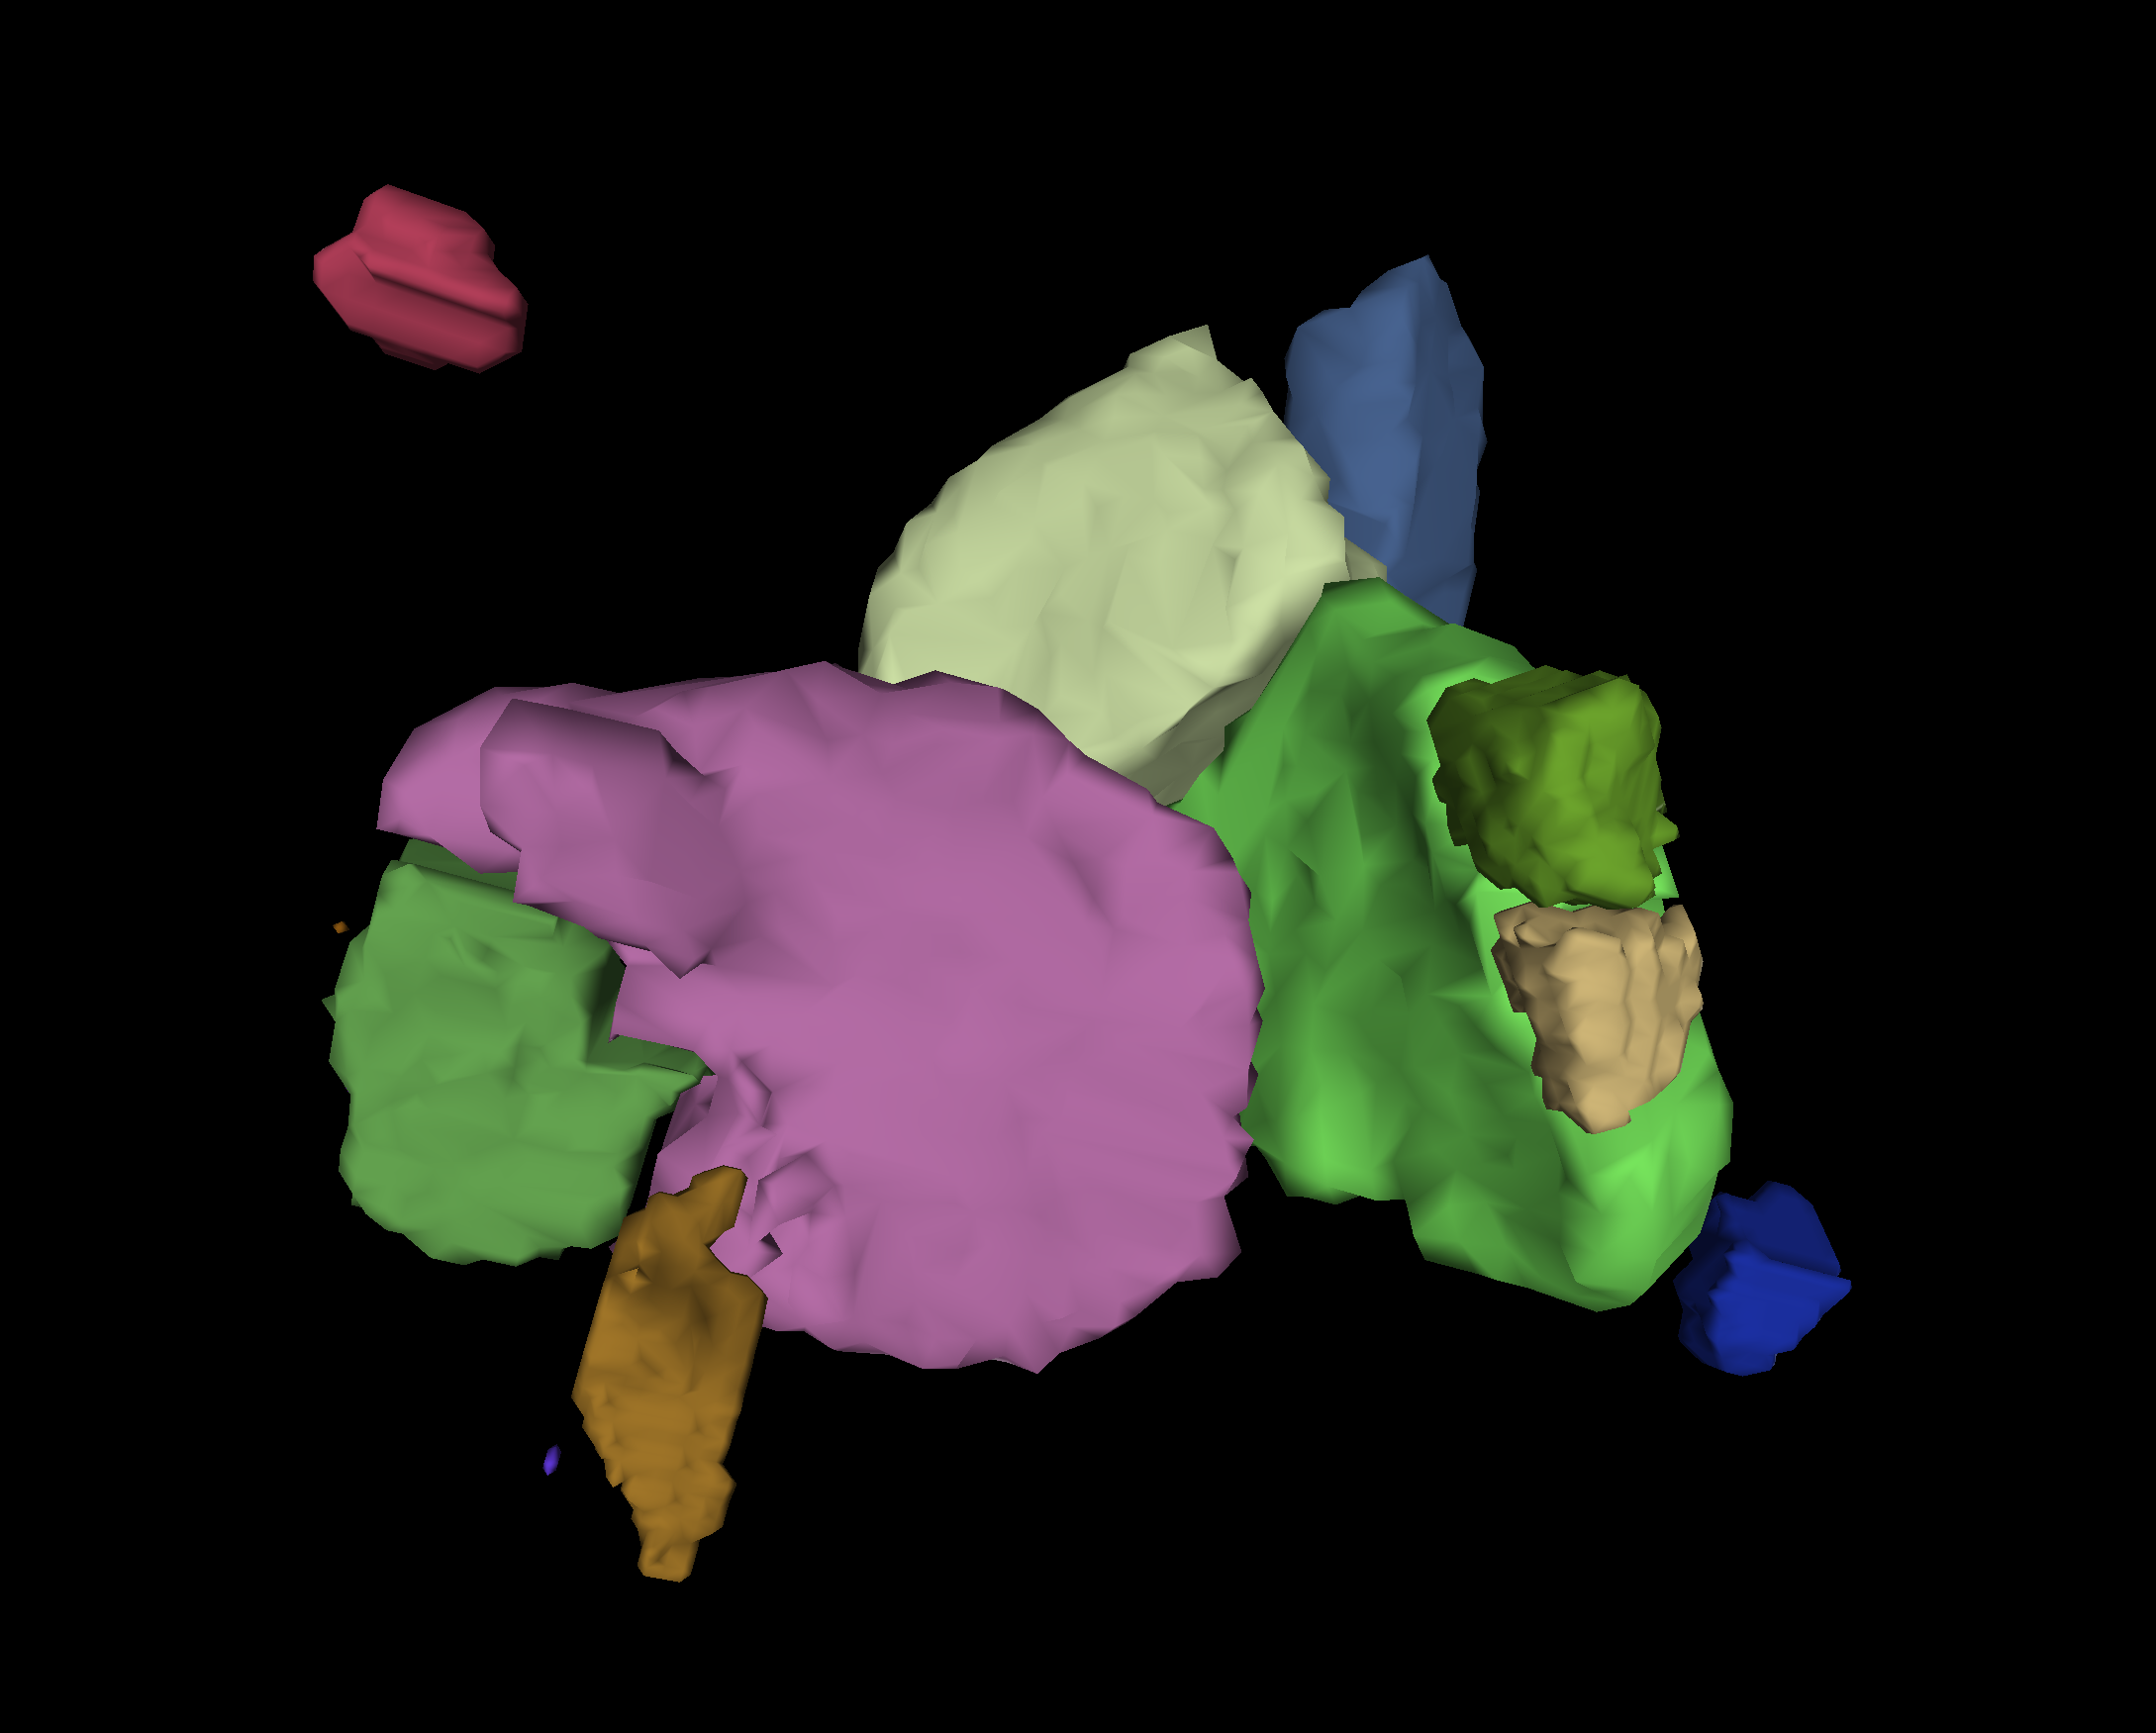
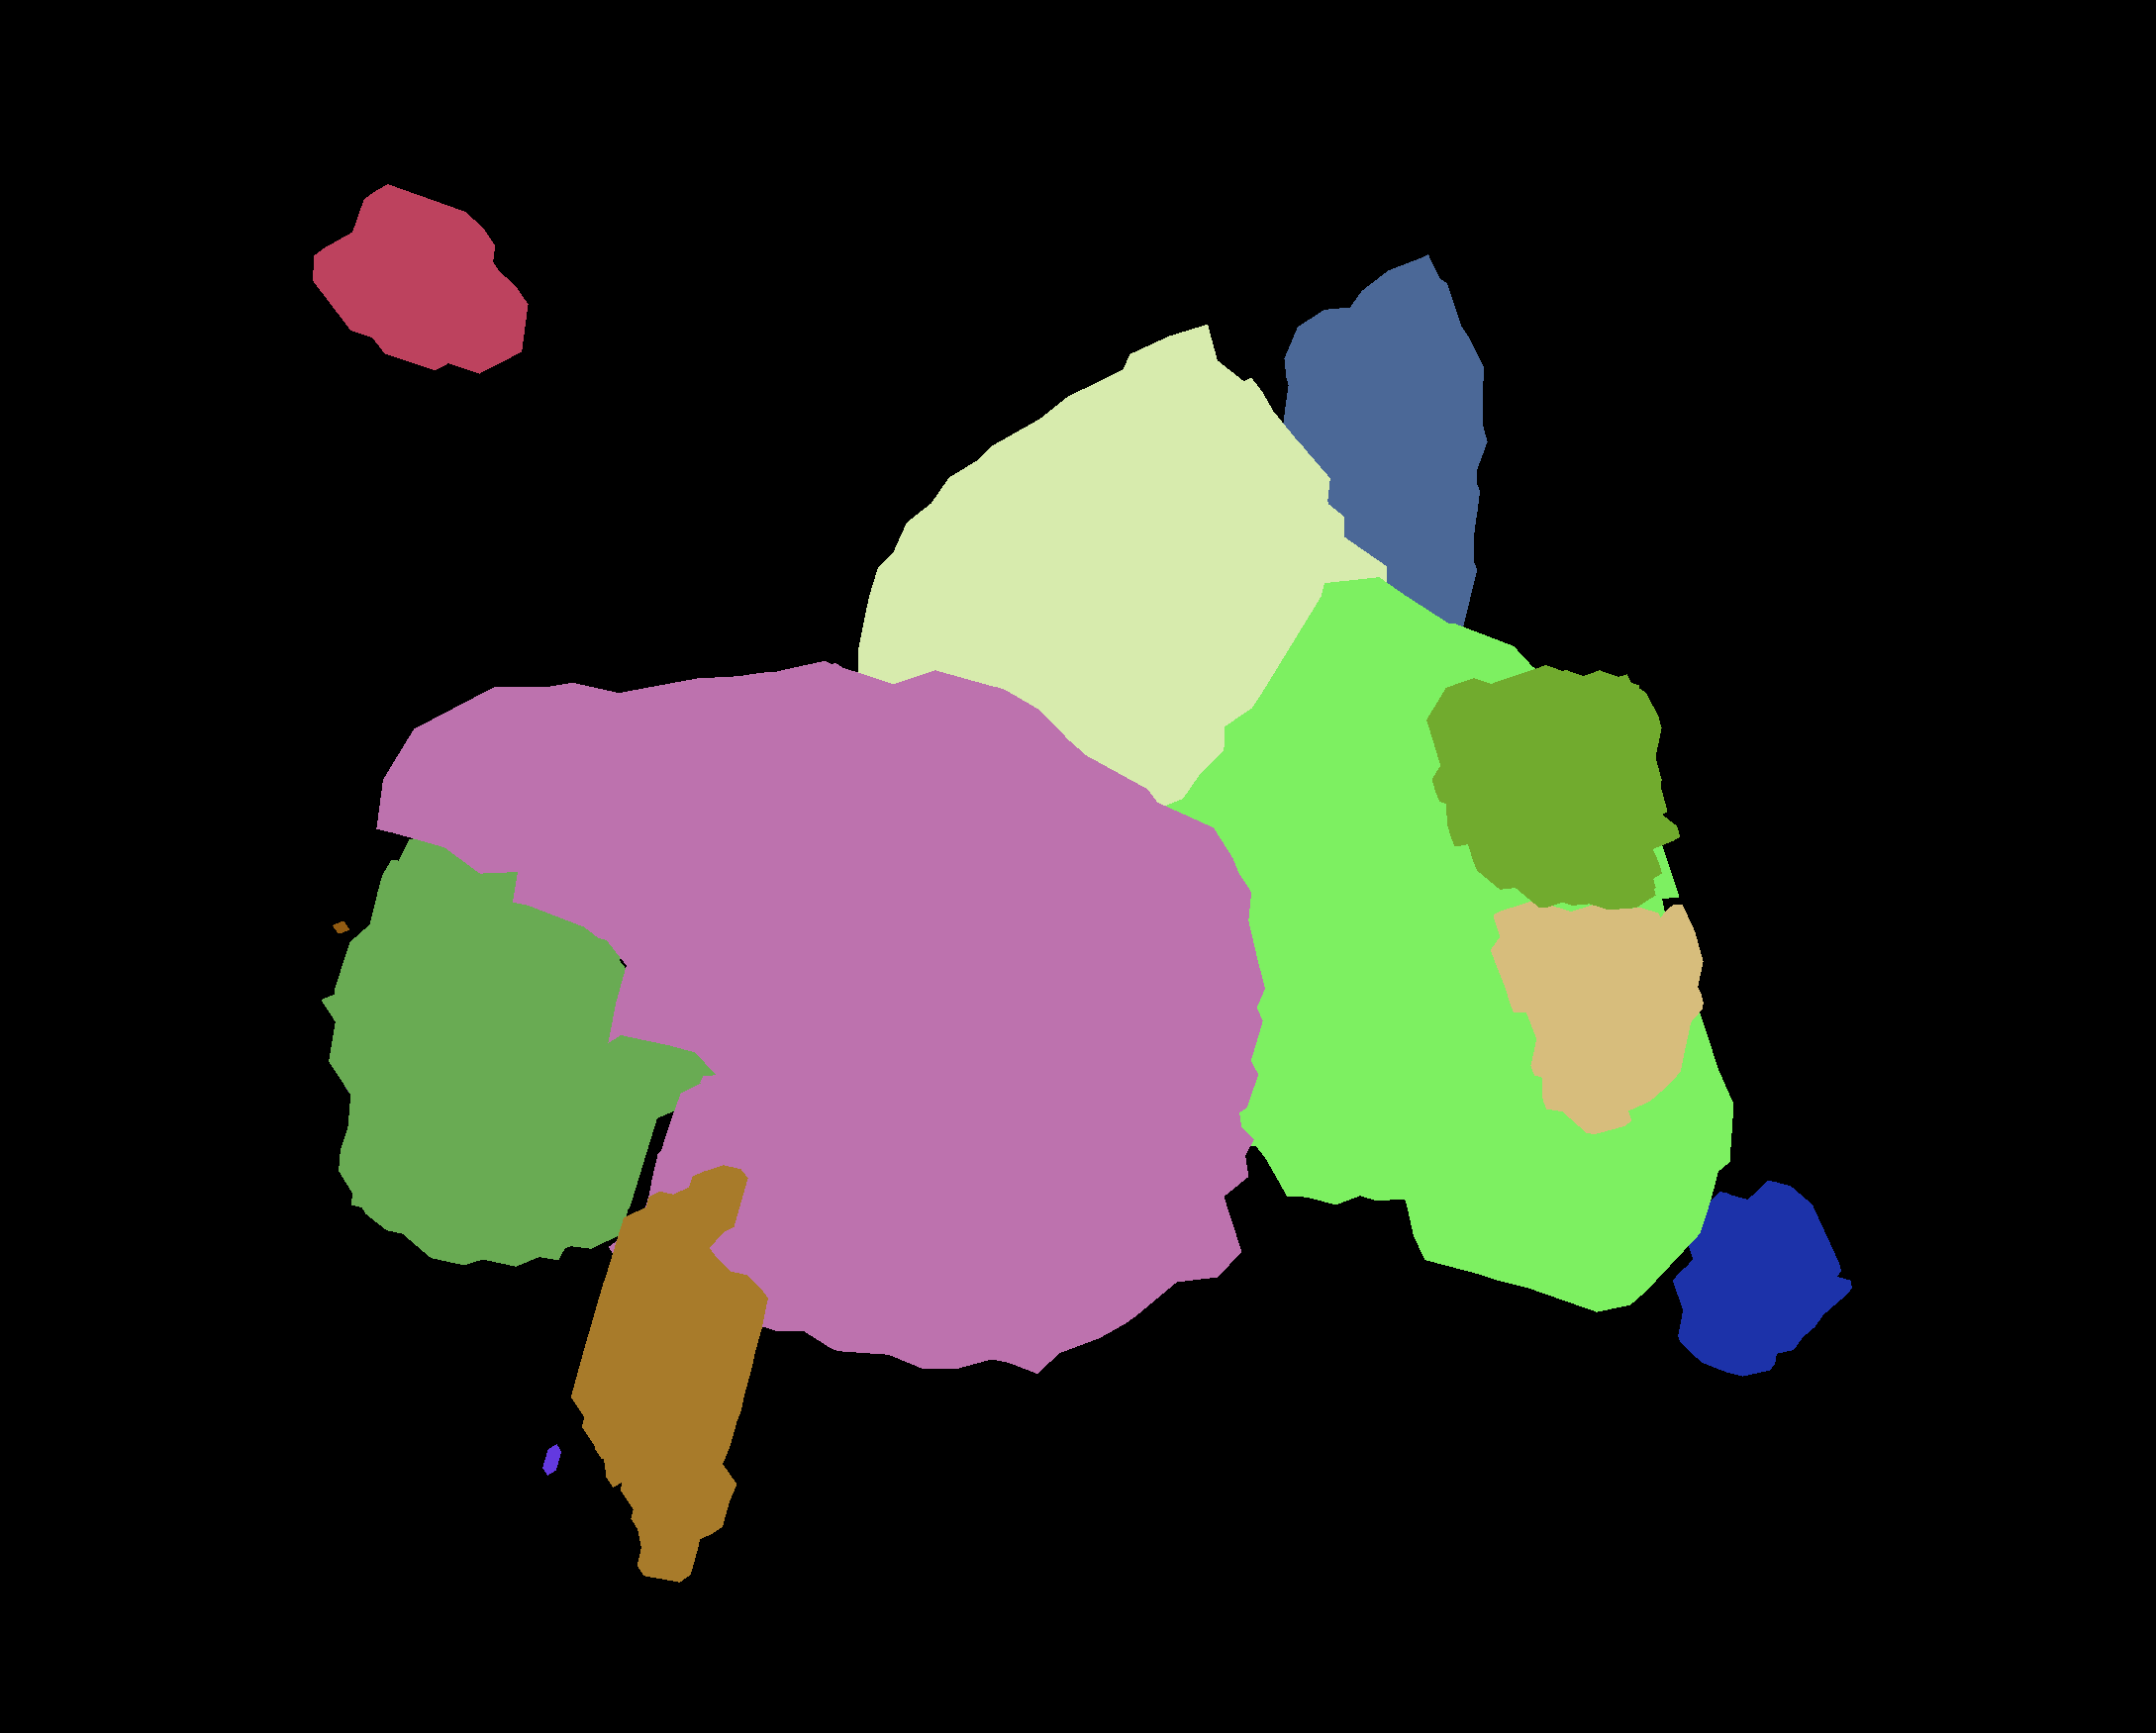
The Shading setting determines the lighting model to use when rendering the surface of the mesh. 3 different shadings are available.
| Flat | Smooth | None |
|---|---|---|
| 
| 
|
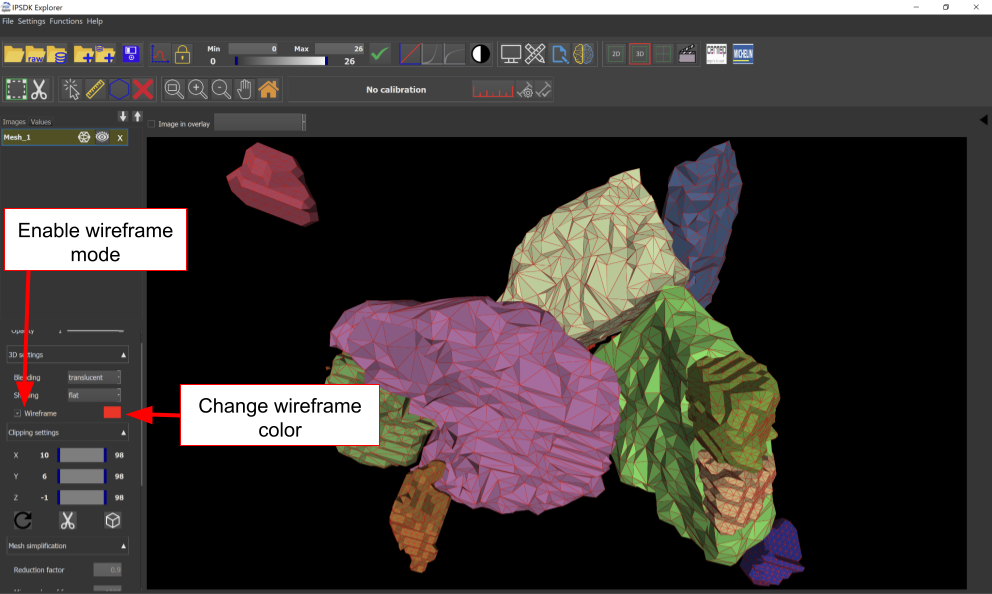
The Wireframe setting allows to show the edges of a mesh. Clicking the wireframe checkbox, under the shading settings, will display the wireframe of a mesh. It is possible to change the color of the edges by clicking the color box next to the wireframe checkbox and selecting a color from the color palette.
Clicking the wireframe checkbox, under the shading settings, displays the wireframe of a mesh. This will show the edges of a mesh. It is possible to change the color of the edges by clicking the color box next to the wireframe checkbox and selecting a color from the color palette.
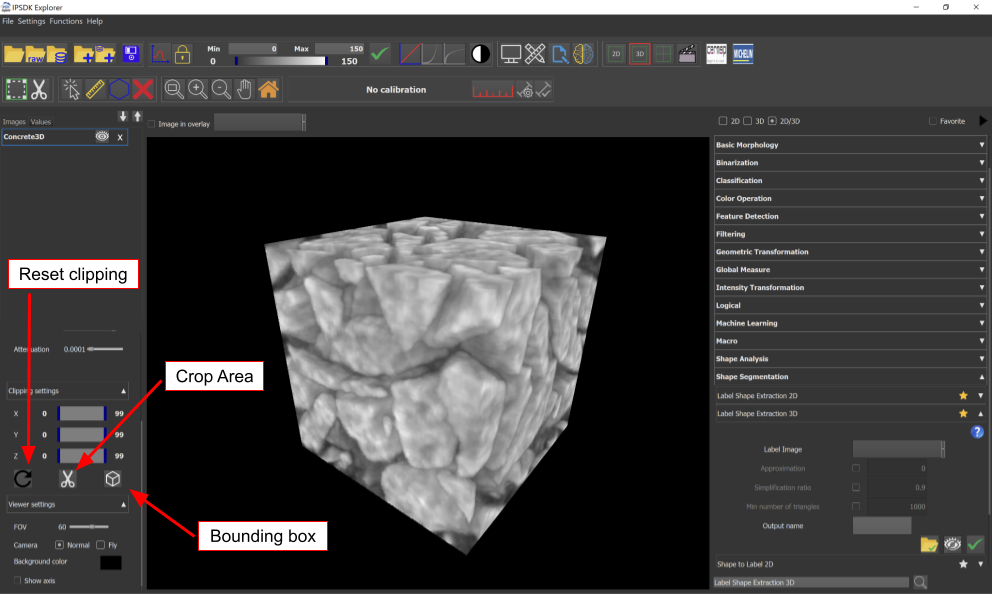
The clipping is a method to create a defined region of interest to work with. It only draws the voxels in the intersection between the clip region. Everything that is outside the region is hidden. Selecting a region with the clipping and applying a crop saves time and energy when doing calculations. The clipping used depends on a plane defined by a 3D point and a direction vector.
It is possible to clip the volume using the 3 sliders under the Clipping settings spoiler. The clipping can be done on the axis x, y, and z.


The goal of the mesh simplification algorithms is to reduce the complexity of a mesh while preserving a high fidelity of the original during simplification.
Mesh simplification is a necessary step in mesh visualization. It allows to reduce the size of a mesh by minimizing the number of faces, merging vertices, or by ensuring that each vertex of a polygon is on the same plane. These methods make it possible to reduce the complexity of the mesh while remaining faithful to the original mesh.
The mesh simplification method implemented for the 3D viewer uses a reduction factor given as a percentage of reduction of the mesh. The value is defined between 0 and 1. The default value is 0.9, for a reduction of 90% of the triangles.
The example below shows what a simplification looks like at different percentages.
| Reduction Factor | Nb of faces | Image example |
|---|---|---|
| 0% | 60620 | 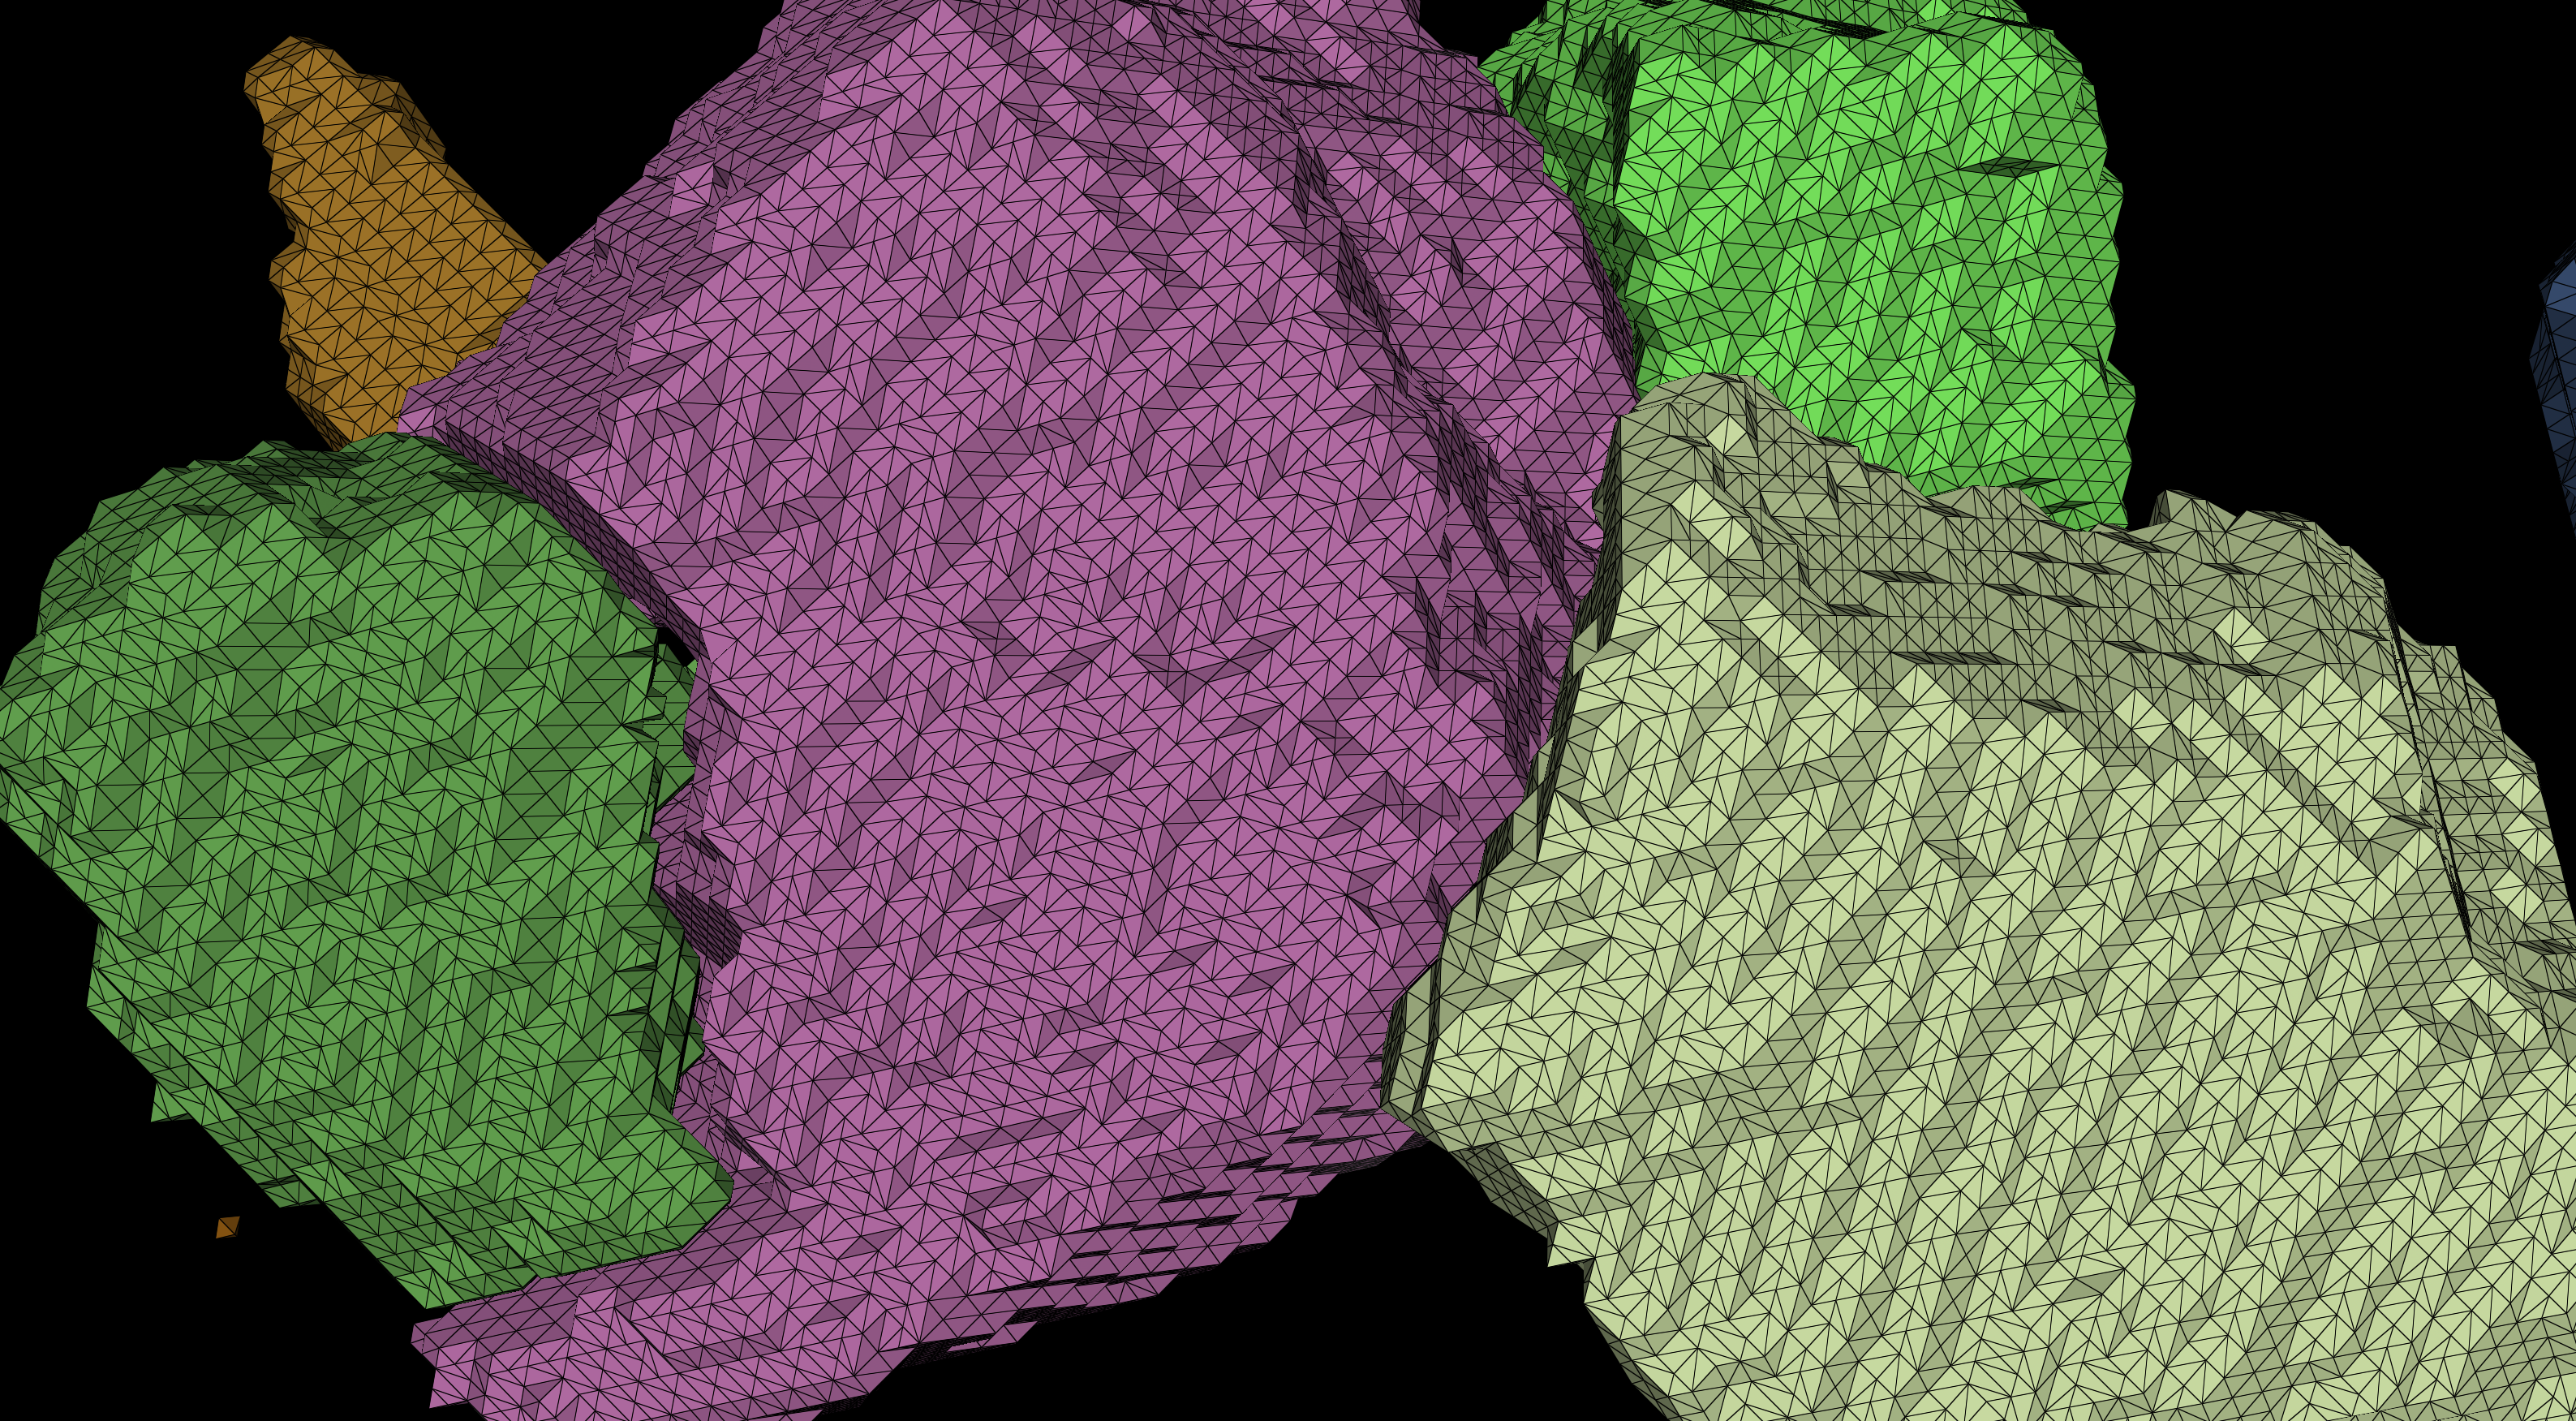
|
| 50% | 33004 | 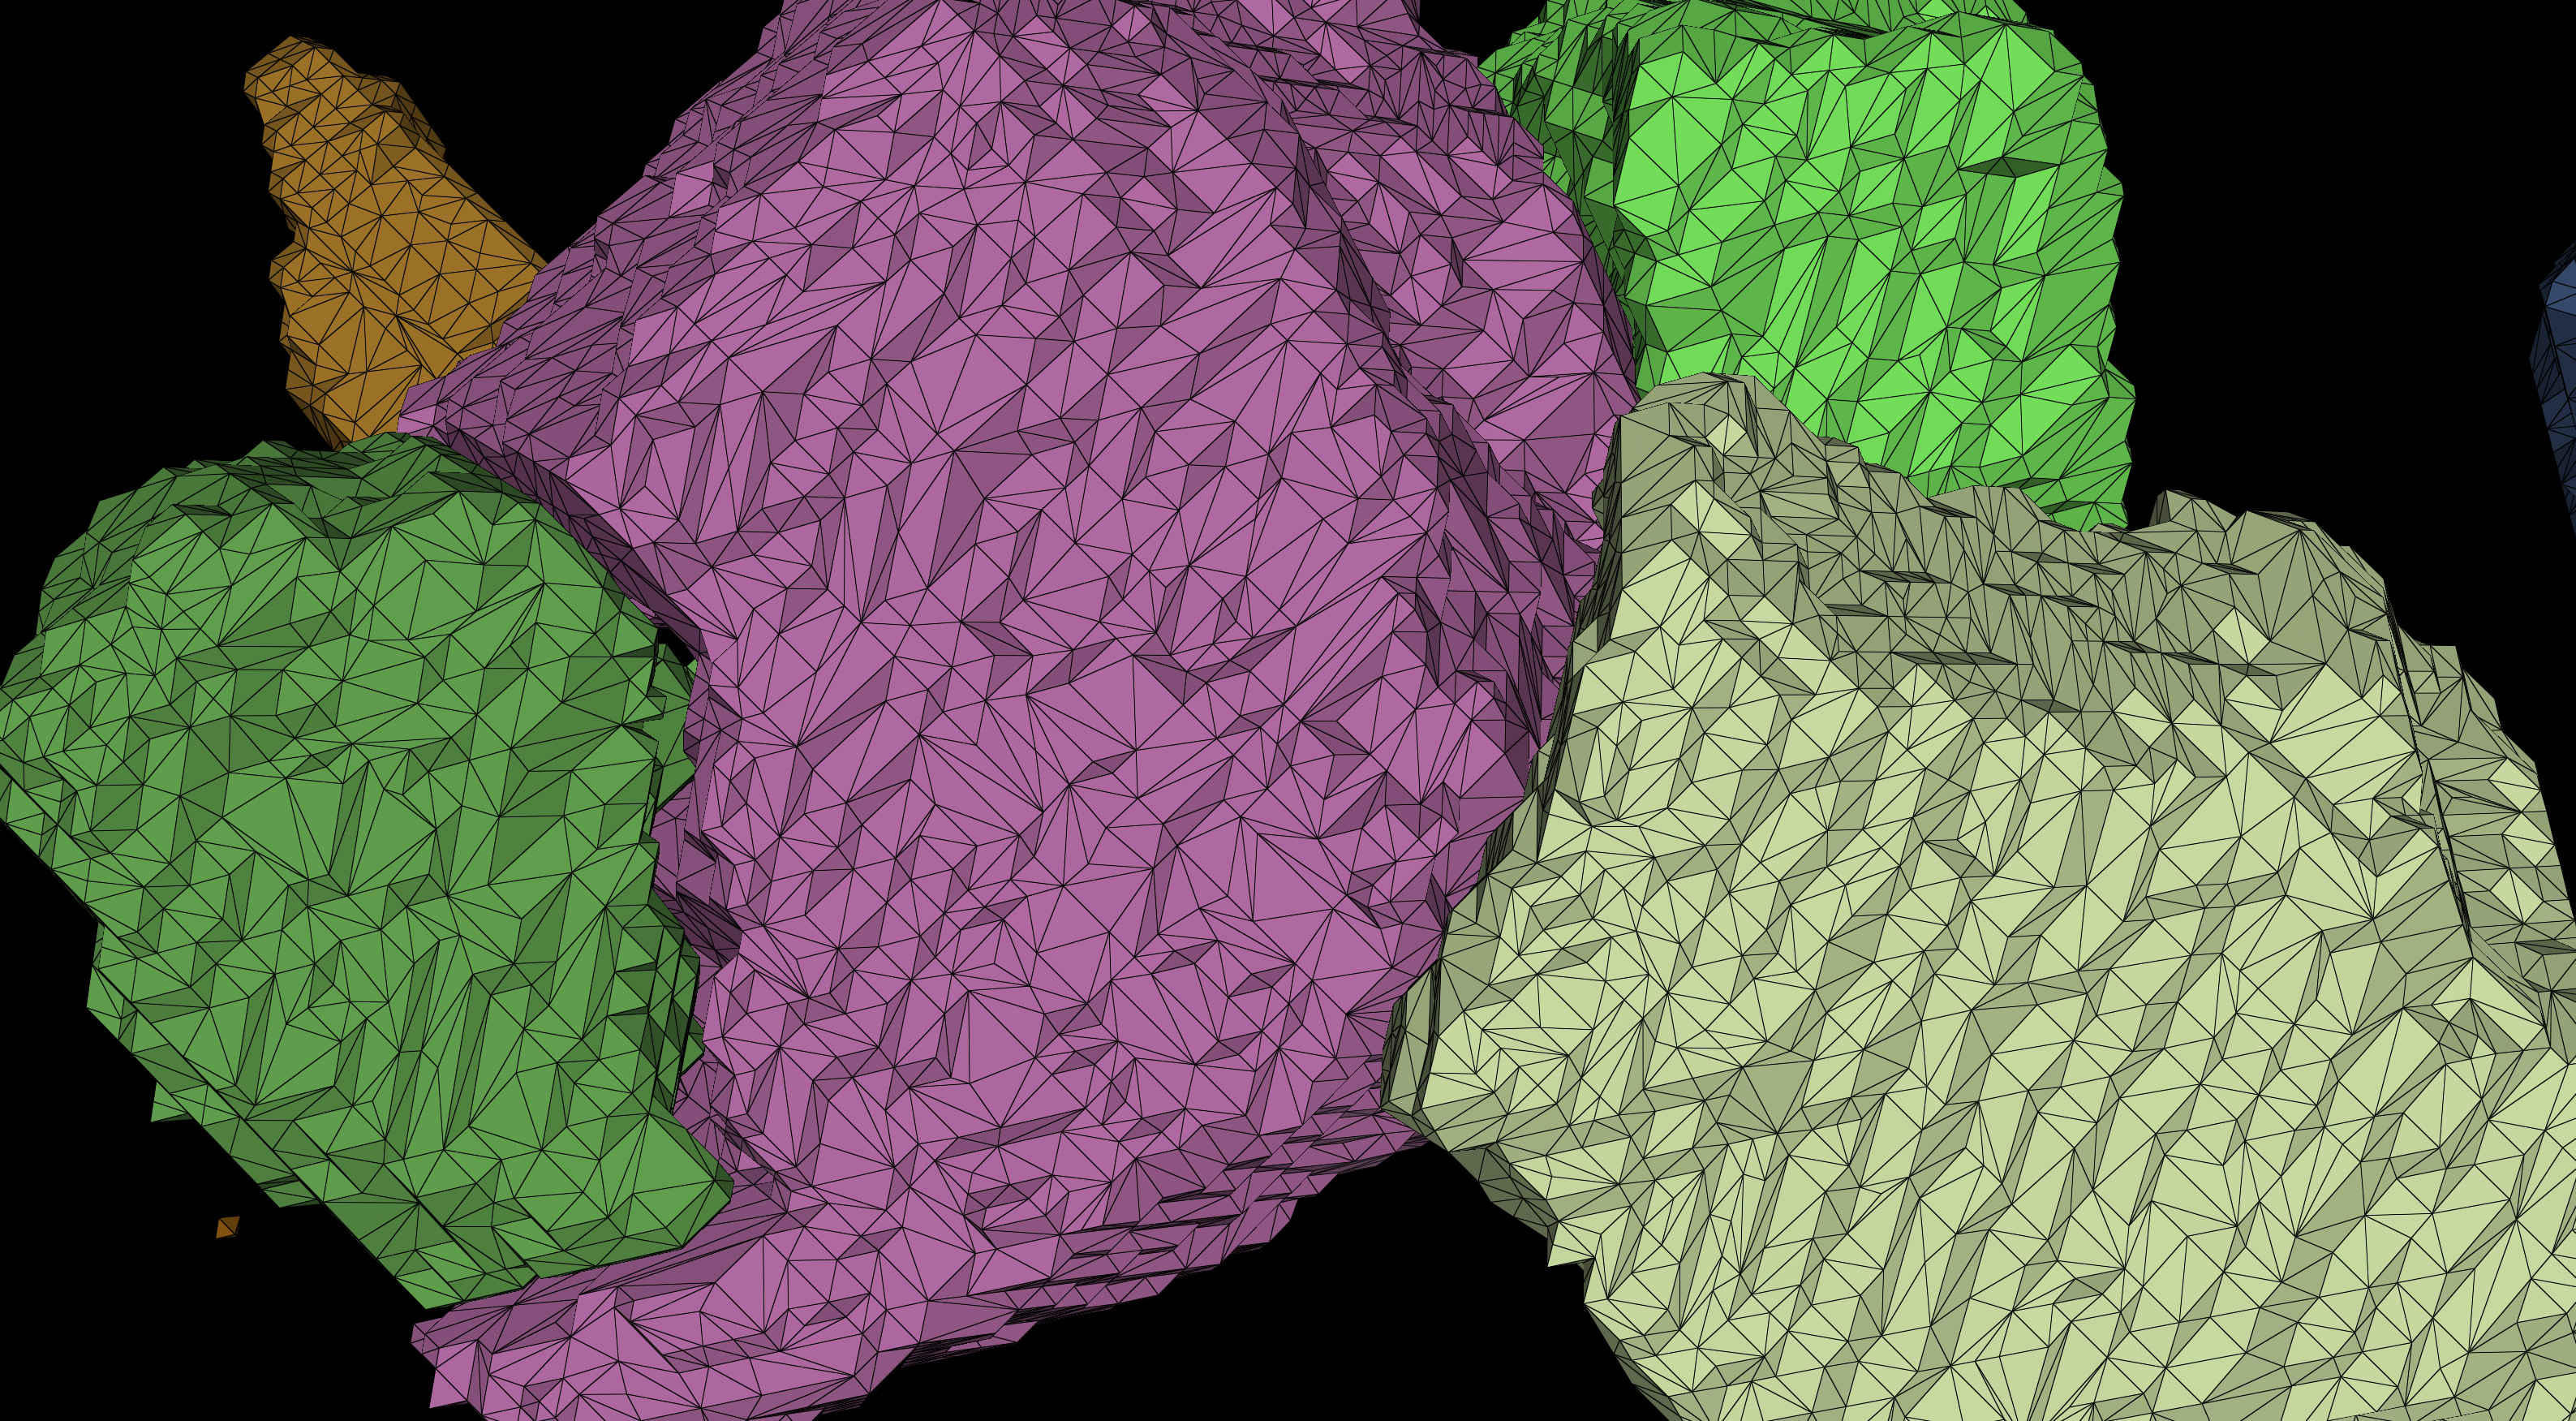
|
| 90% | 12072 | 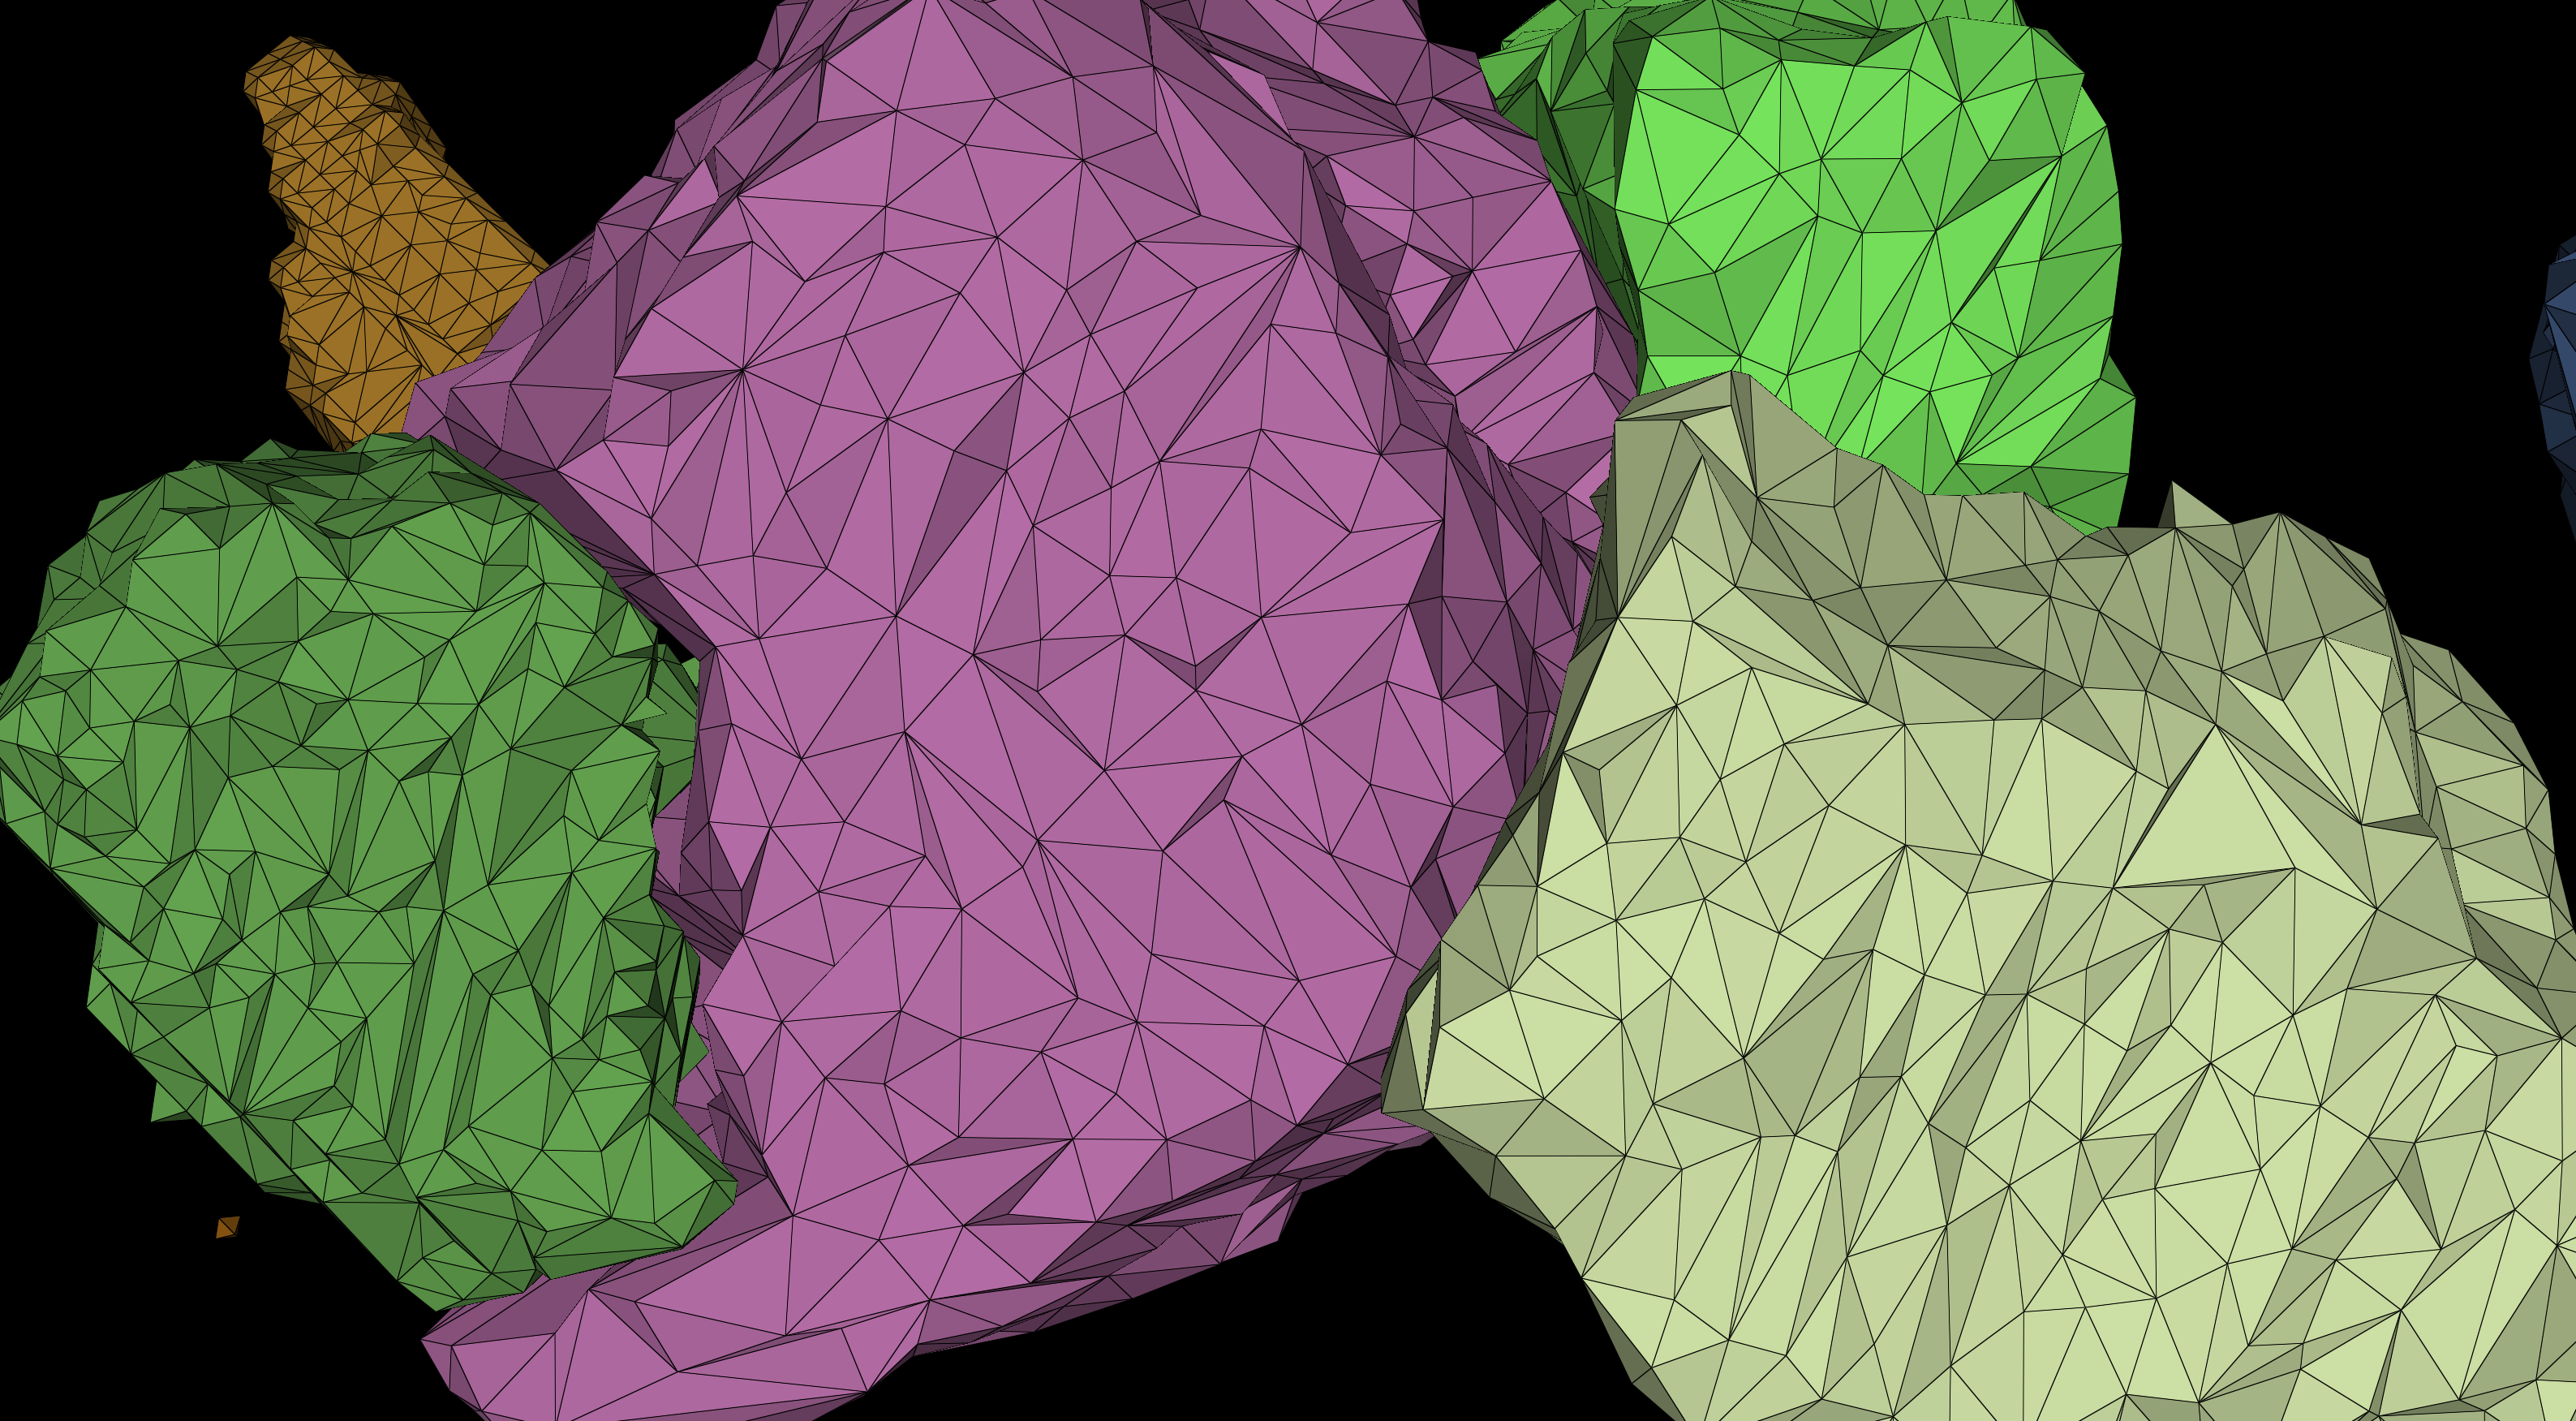
|
A number of minimum faces can also be specified. This number will help to limit the number of faces for every shape in the mesh and thus avoid oversimplifying them and deteriorating them. A shape is a disconnected component in the mesh. Its default value is 1000.
The example below shows the difference between a minimum of 1000 triangles, and a minimum of 100 triangles.
| Min Triangles | Example |
|---|---|
| 100 | 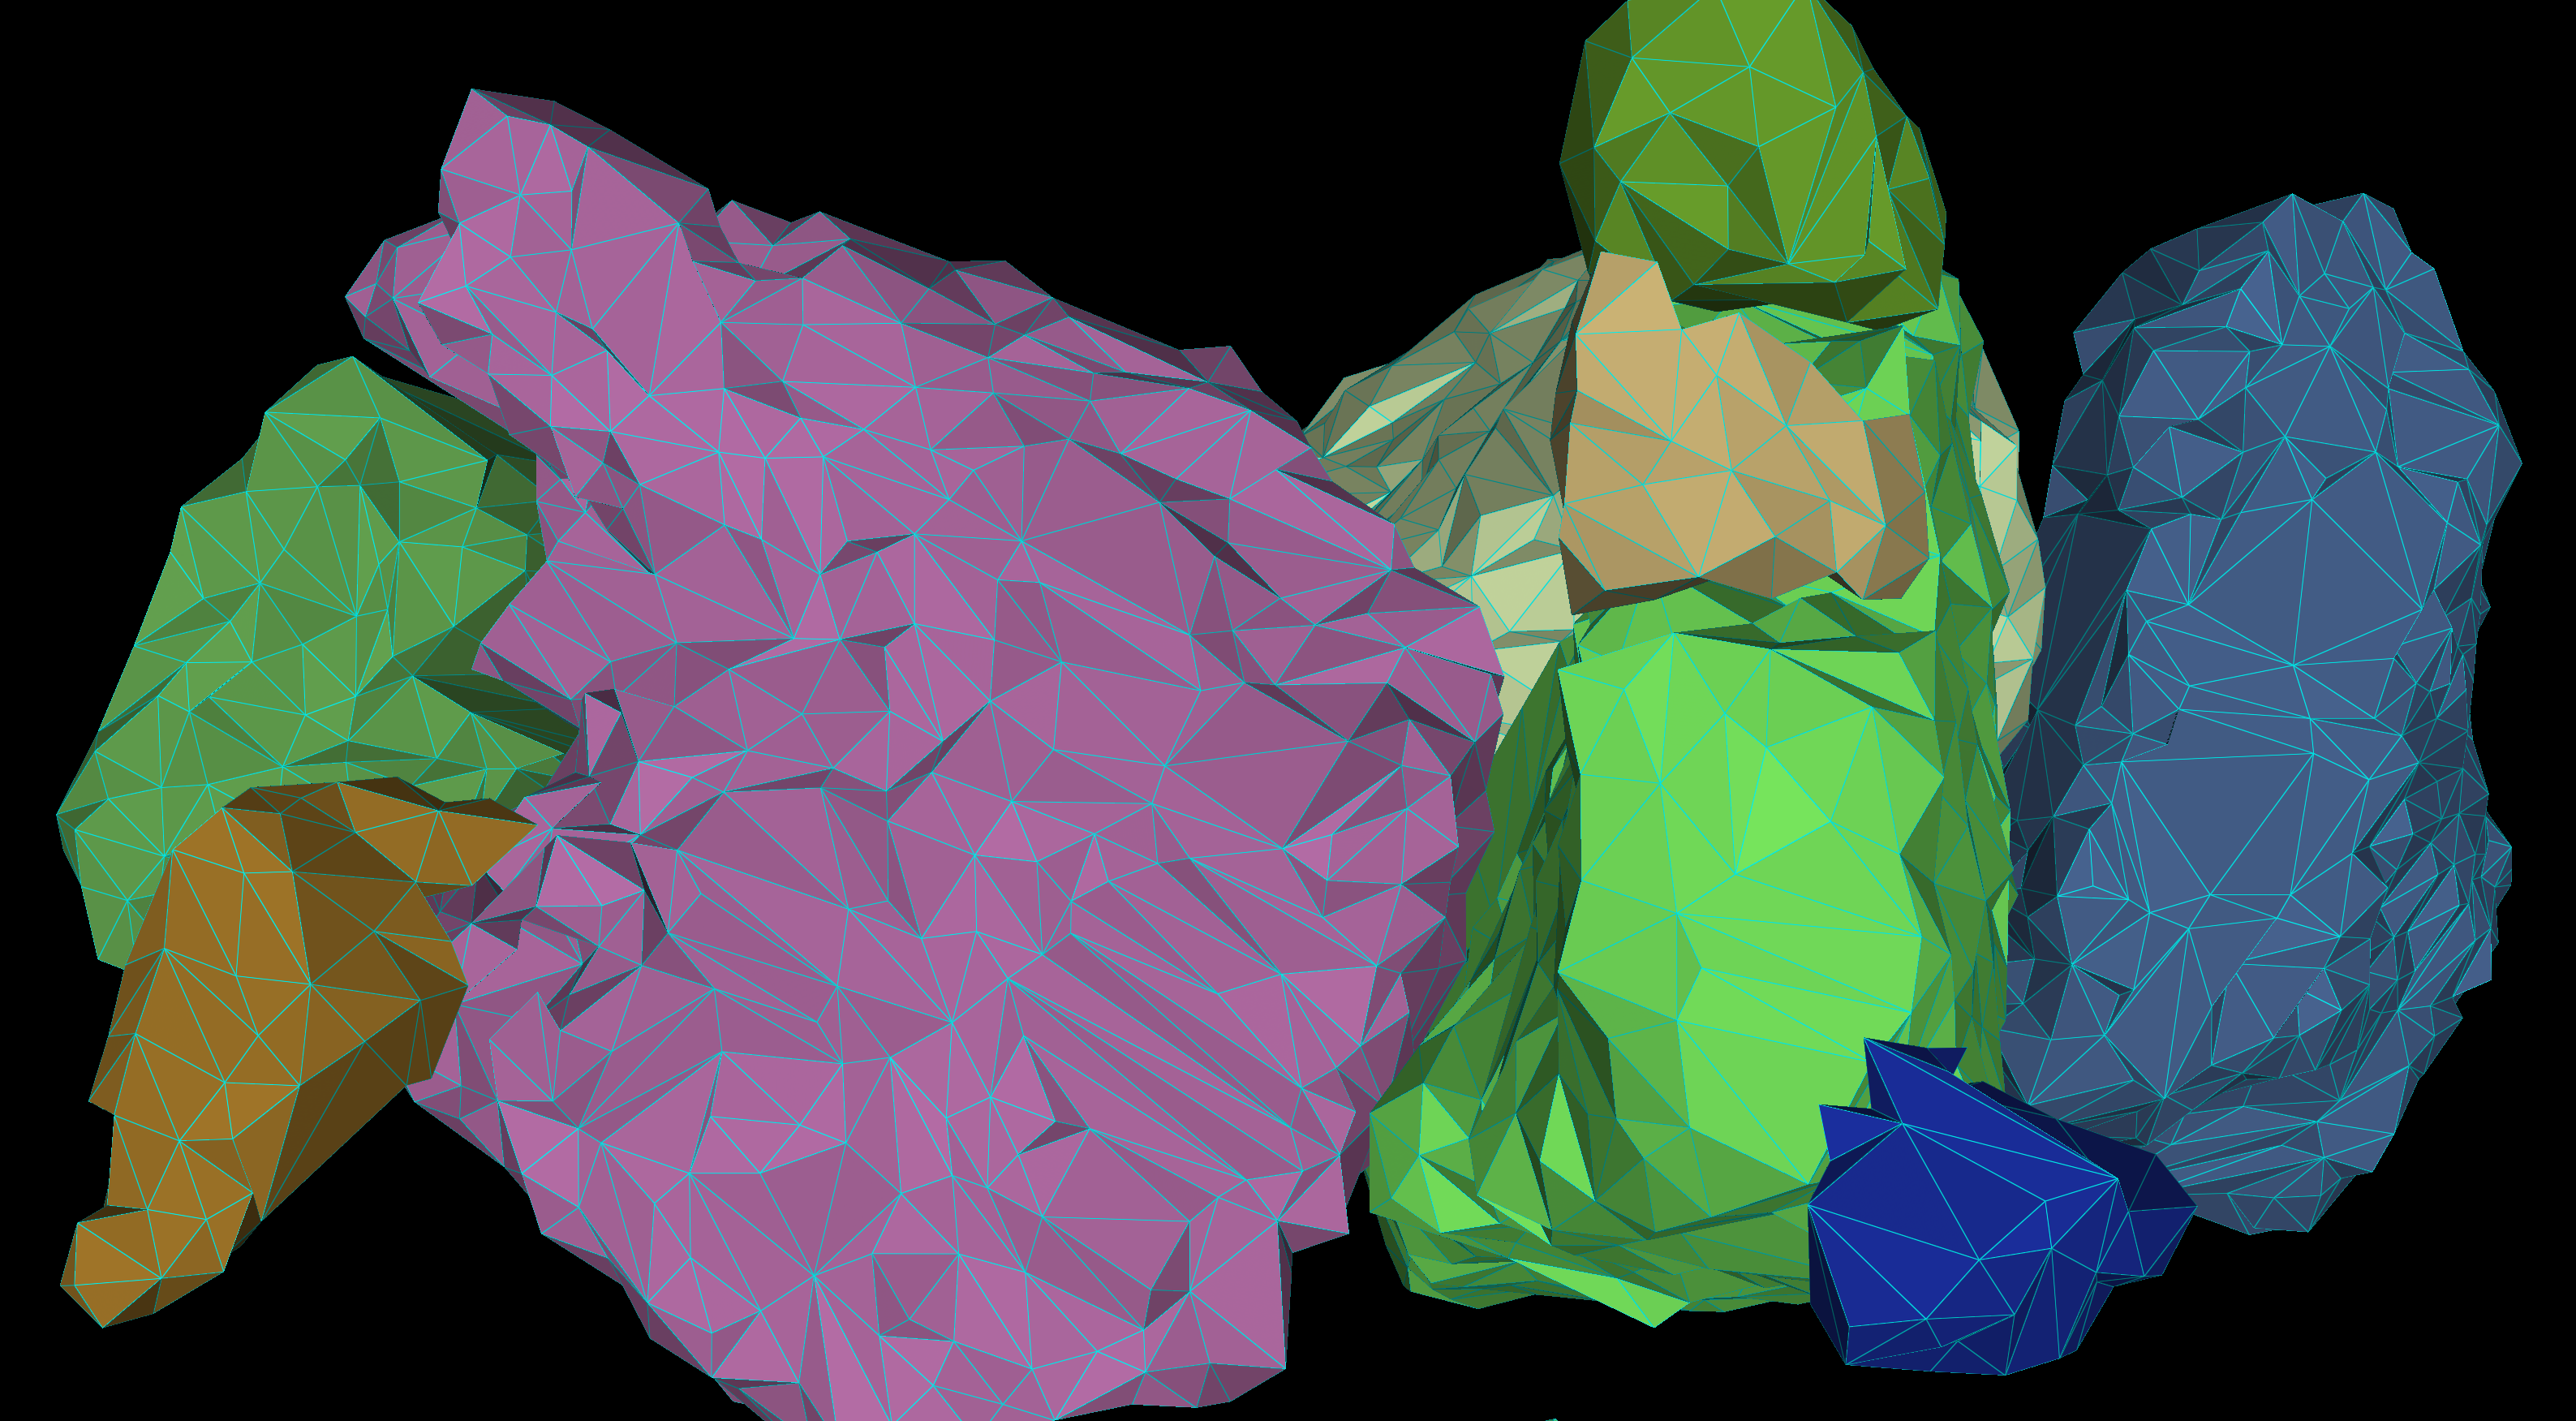
|
| 1000 | 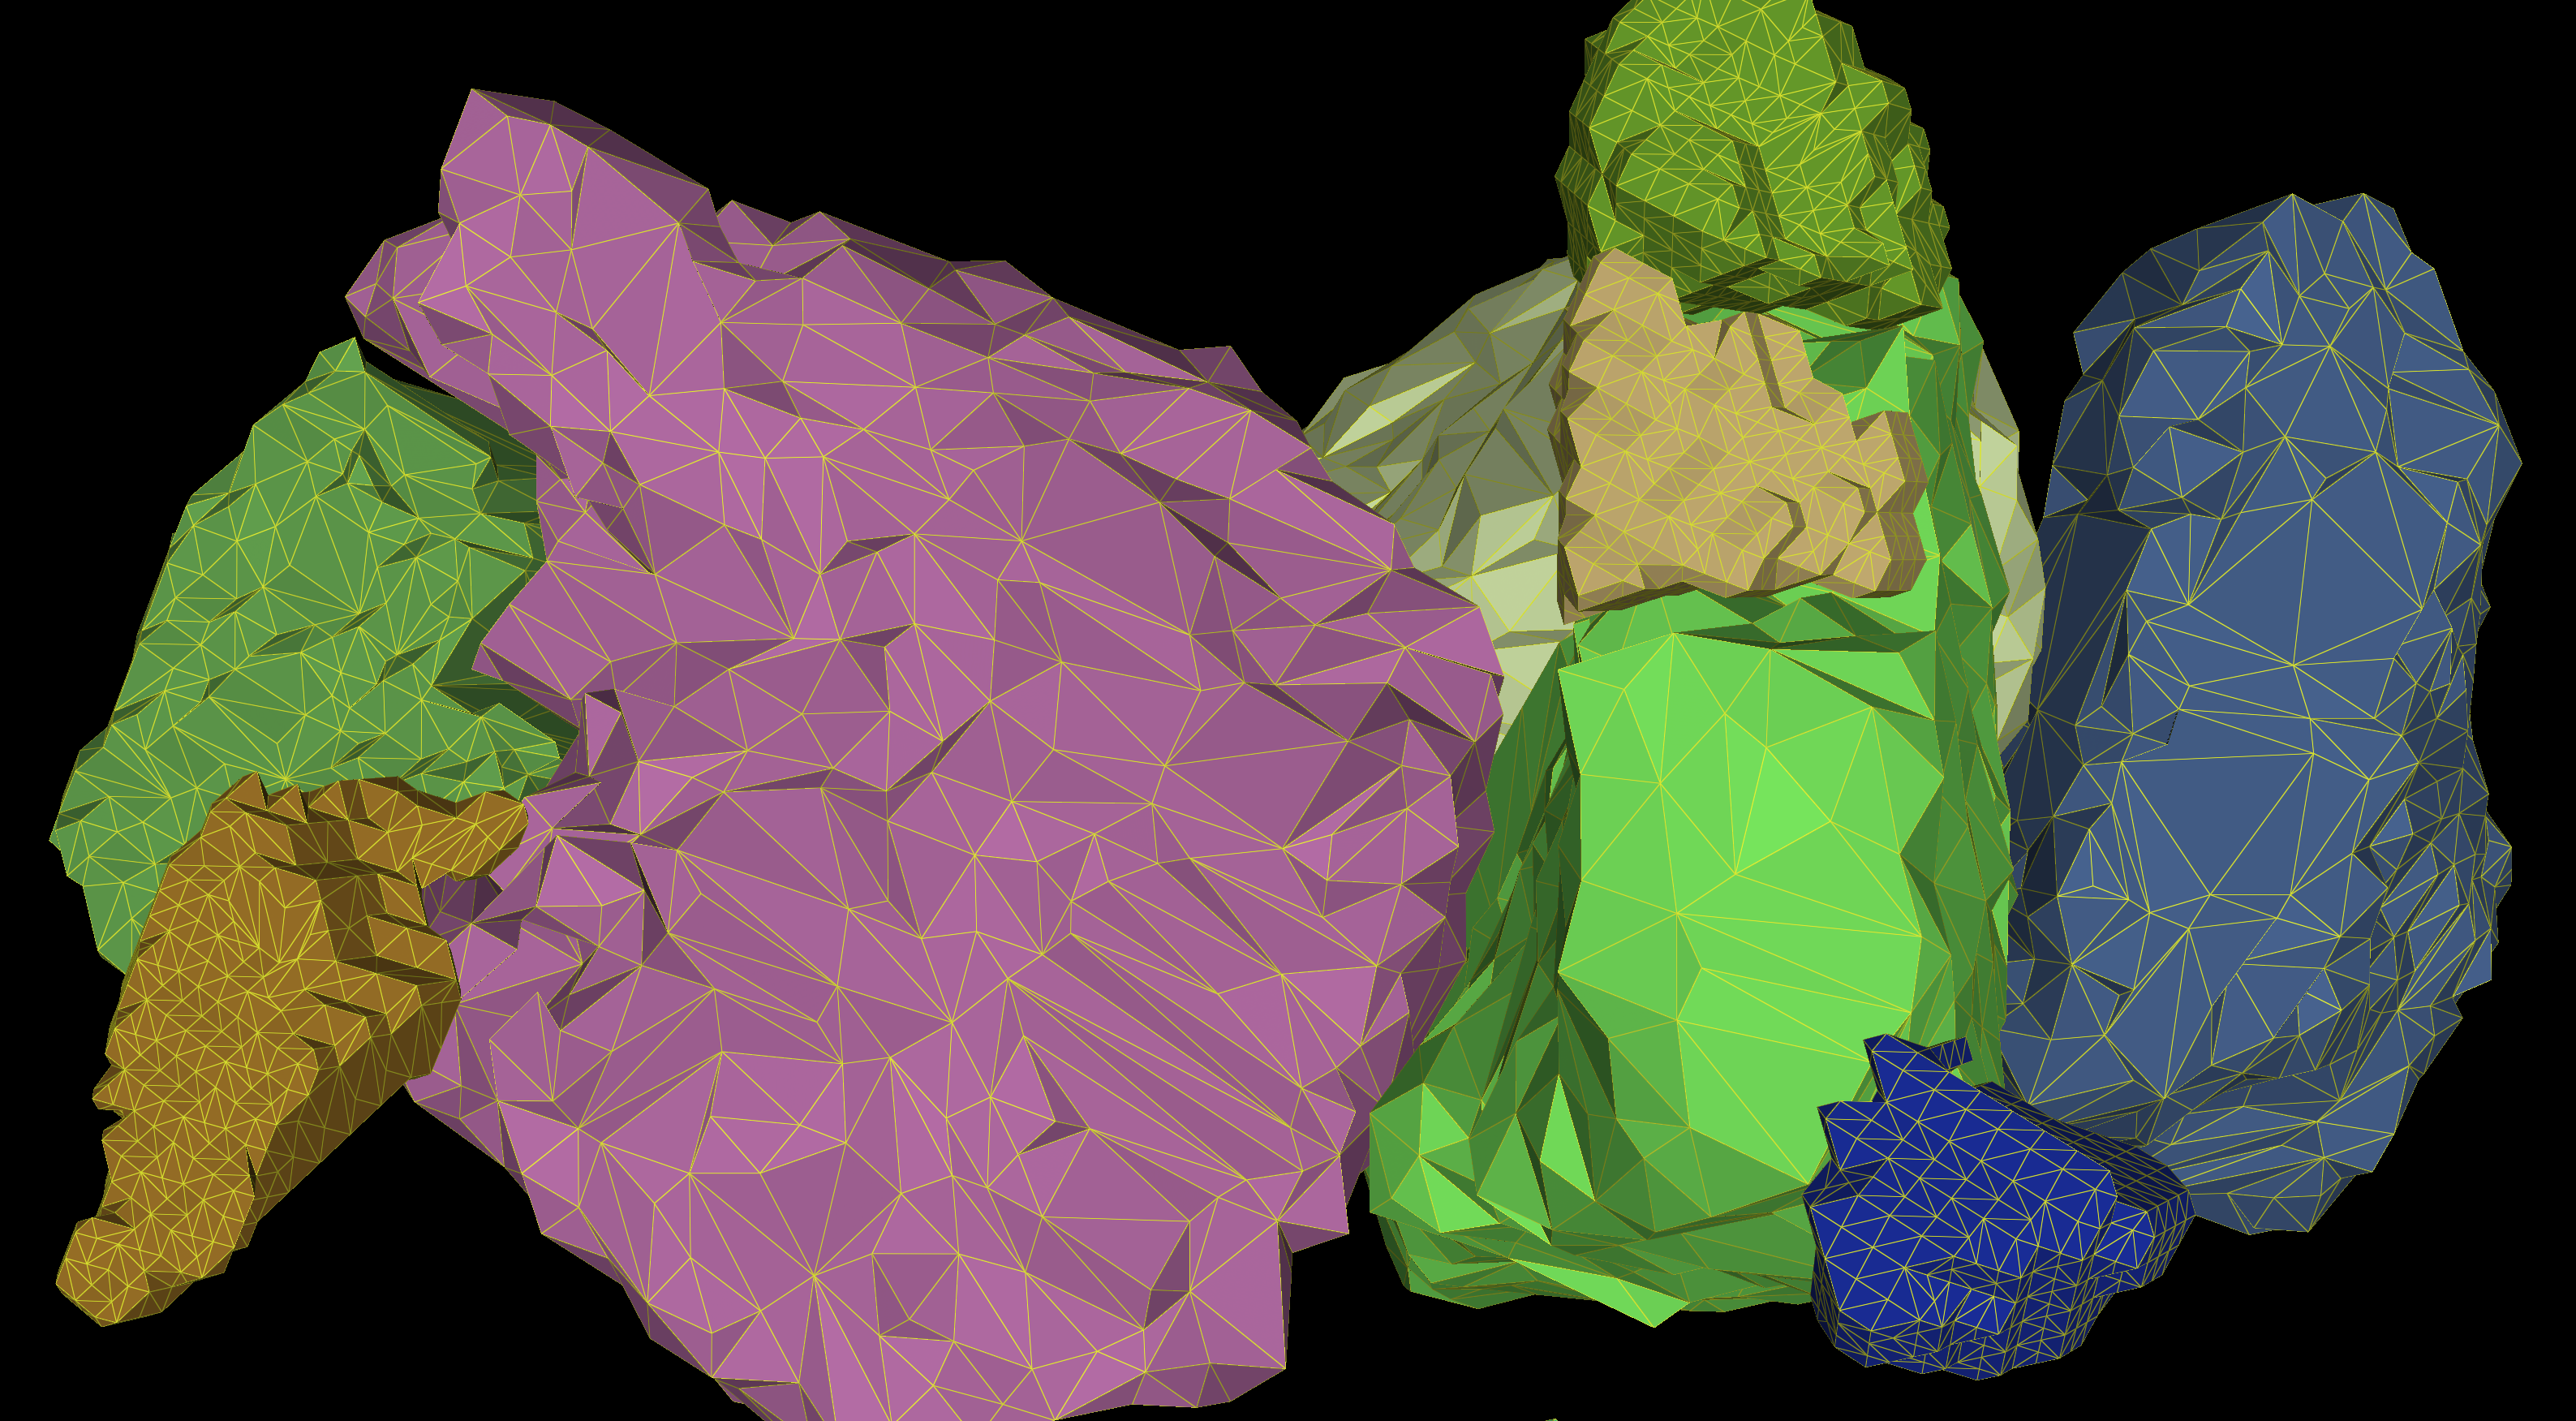
|
Some settings are global to the viewer and will apply whatever the volume selected. Those implies the background color, or the camera settings.
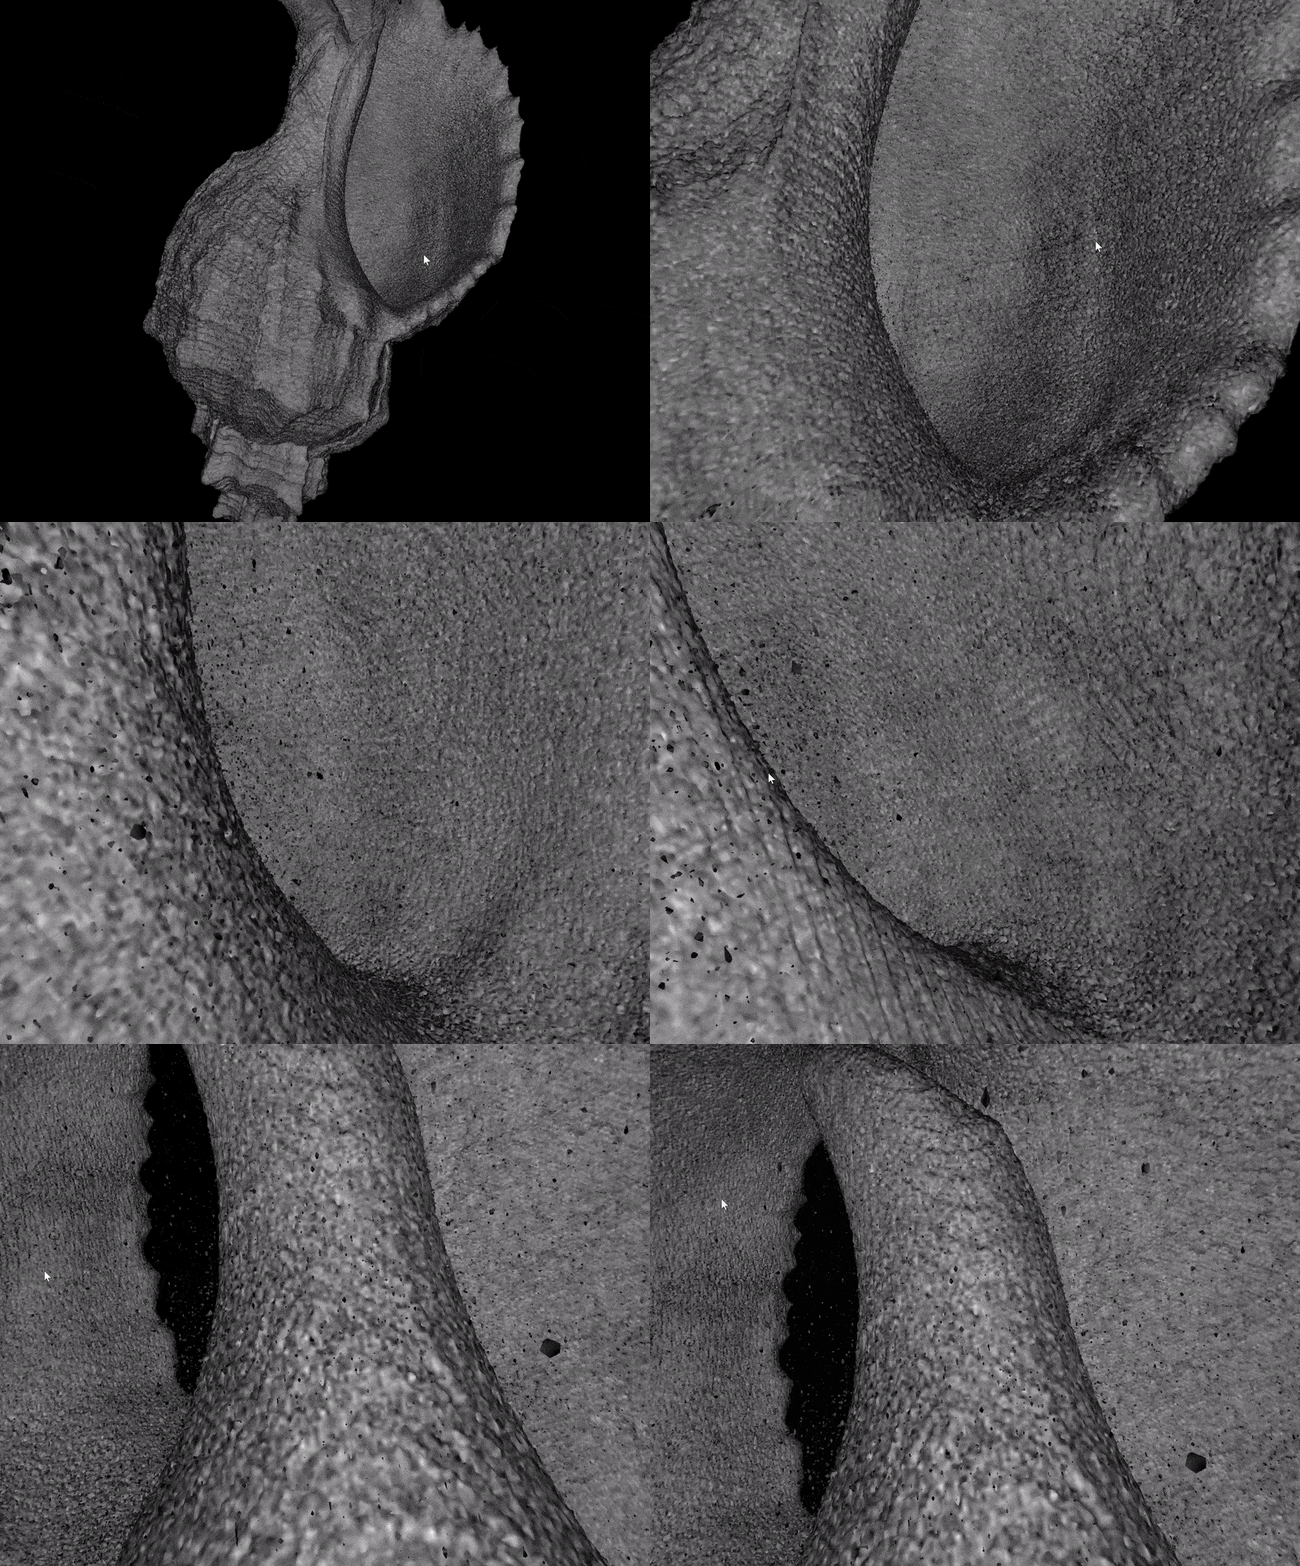
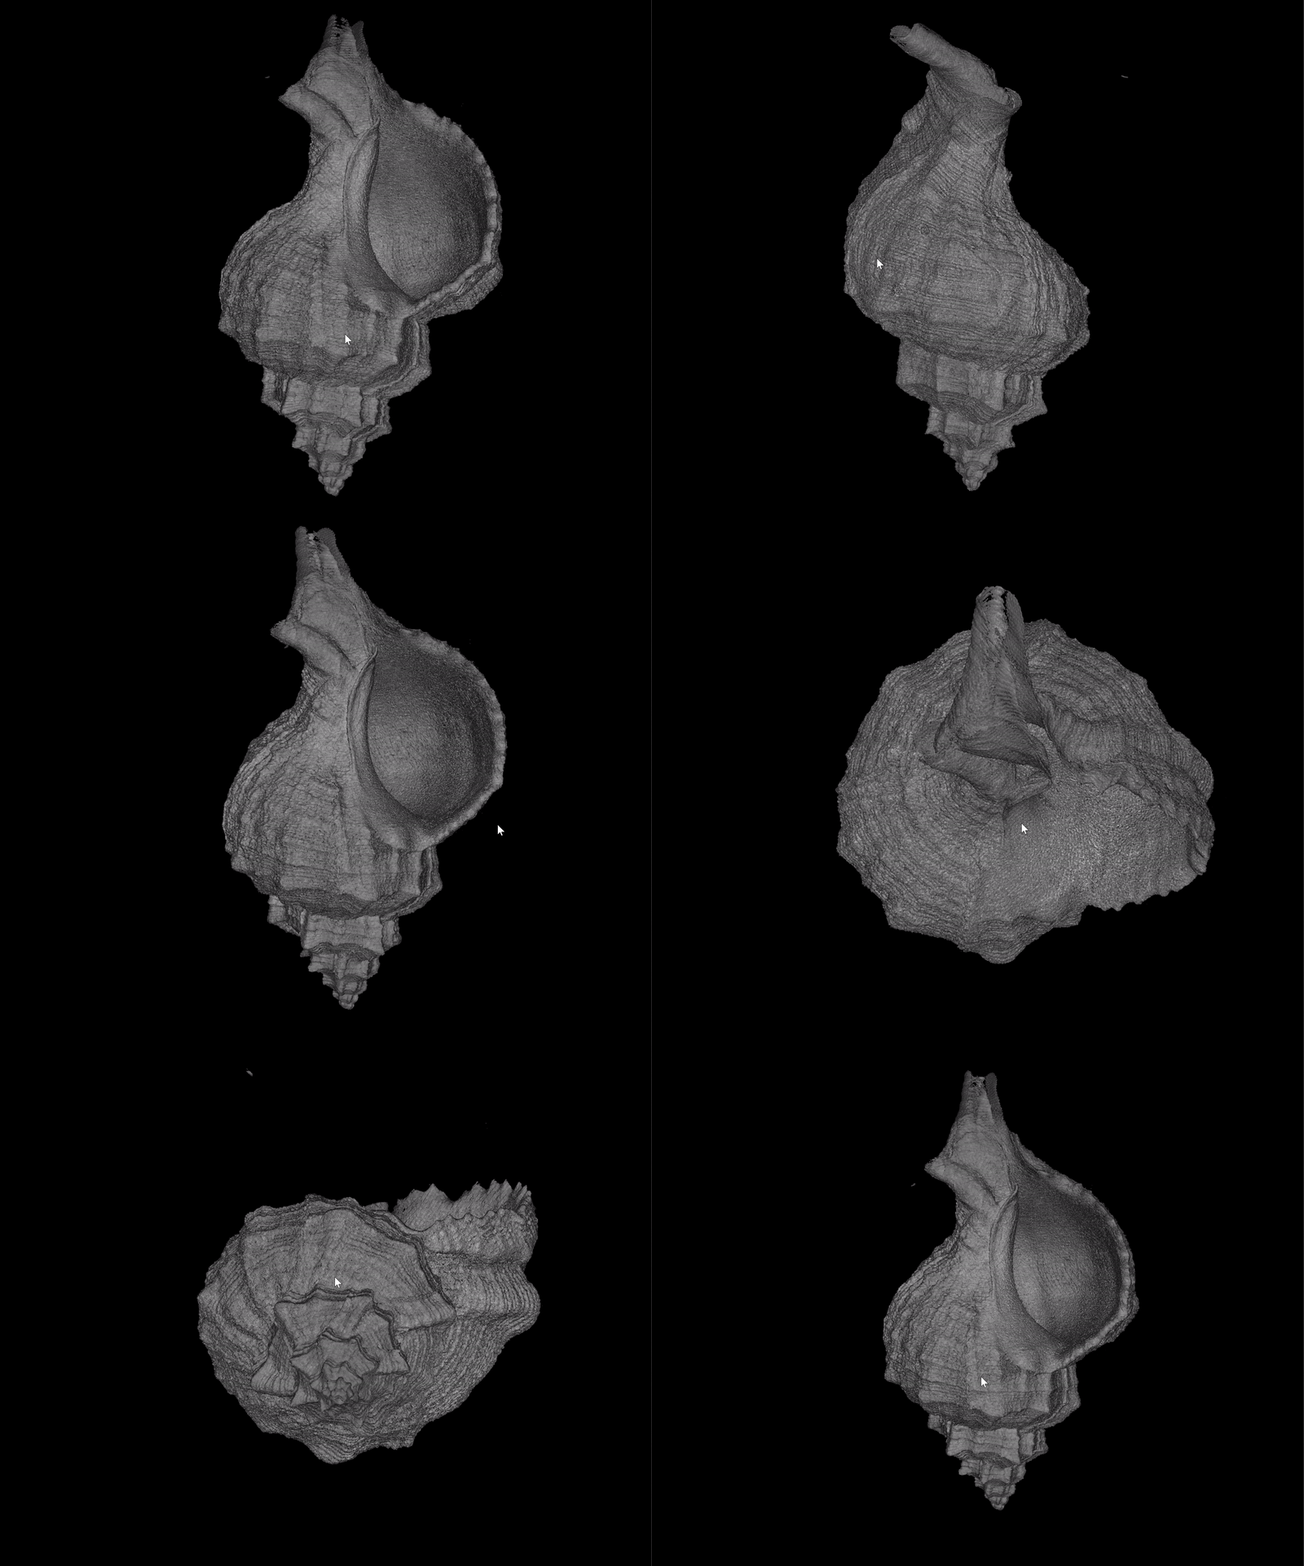
It is possible to choose between two camera modes. The normal mode is using a Turntable camera which turns around a volume. The fly mode is using a Fly camera and allows to enter an interactive mode and move inside the volume interactively using the mouse and keyboard to navigate.
| Fly camera | Turntable camera |
|---|---|
| 
|

The FOV slider will allow to change the field of view angle of the camera. If 0, the camera is in orthographic mode.
It is possible to select a different background color by clicking the color box next to the background color setting and selecting a color from the color palette.
Axis can be displayed in the viewer by checking the box "show axis" .
[1] https://napari.org/stable/
[2] https://en.wikipedia.org/wiki/Nearest-neighbor_interpolation
[3] https://en.wikipedia.org/wiki/Linear_interpolation