detects 2D lines from the extraction of local maxima in the accumulation Hough matrix computed on the input image
Preamble
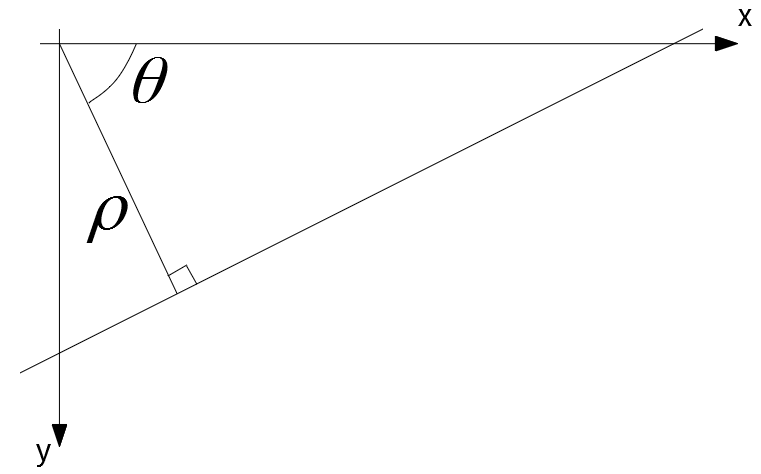
In Hough transform, lines are expressed in polar system. The equation of a line is:
![\[ \rho = x_0 \cos \theta + y_0 \sin \theta \]](form_383.png)
with  and
and  constants and
  and
and  the variables of the equation. , expressed in pixels, corresponds to the orthogonal distance between the origin of the considered reference frame and the line, while , expressed in radians, corresponds to the clockwise angle between the x-axis and the normal to the line (clockwise because, in image reference frame, y-axis points towards bottom).
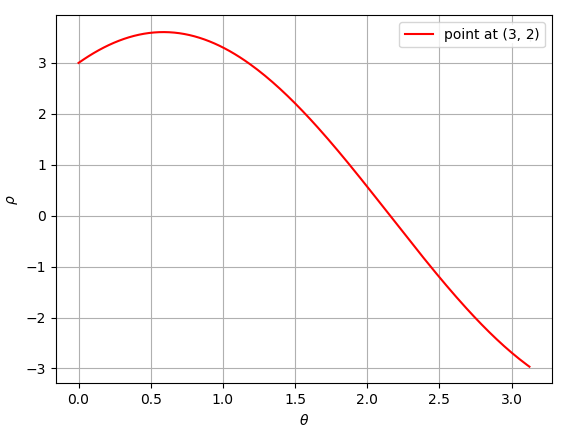
For a given range of orientations, the family of straight lines going through a given point  in cartesian coordinates can be written as:
![\[ \rho_{\theta} = x_0 \cos \theta + y_0 \sin \theta \]](form_389.png)
If we plot, for instance, the family of lines going through point located at (x=3, y=2) in a graph with  in ordinates and in absciss, we obtain:
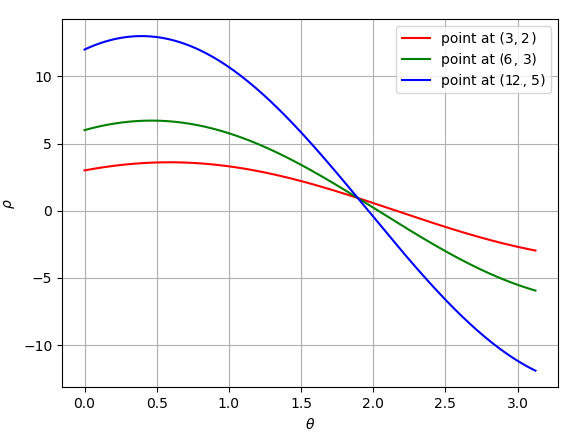
Now, let's add in this graph the 2 families of lines, respectively going through points (6, 3) and (12, 5):
We can see that our 3 sinusoids intersect in one single point  , that corresponds to the line going through the 3 points (we chose 3 aligned points on purpose for our example).
In conclusion, lines can be detected at positions in the graph where there are a lot of intersections between sinusoids.
Hough accumulator matrix construction
Hough accumulation matrix takes advantage of the property described above.
Considering:
- a 2d grey levels input image
- a range of orientations,
 , and
, and  , so that
  and both extrema belong to
 ![$ [0, \pi] $](form_395.png) range (default values:
range (default values:  and
and  )
)
- a number of bins for orientations (integral and strictly positive) (default value: 180)
- a step for , strictly positive (default value: 1.0)
- an intensity threshold (default value: 0)
The Hough transform applied to the input image with the described parameters realizes the following steps:
- generate an output 2D accumulation matrix, in the form of an image, with the following dimensions:
- a number of lines that equals at least to the number of bins for orientations
- a number of columns that equals at least to the number of bins for (deduced from the step parameter and from the maximal value, that equals to half the length of diagonal of the input 2D image)
- initialize the content of this accumulation matrix with 0 values
- for each pixel of the input image at position (x, y) having an intensity greater than the "intensity threshold" input parameter, compute, for each bin of the orientation range, the associated
 value of the line going through point (x, y), and increment with the intensity value the associated pixel in the output accumulation matrix
To reduce the number of columns of the accumulation matrix, the origin of the polar reference frame has been positioned at the center of the image. Thus, the maximal absolute value of equals to half the length of the diagonal of the image (it would have equaled to the length of the diagonal if origin had been positioned at the origin of the image)
All the parameters described above are defined through the data item HoughLinesImgParams.
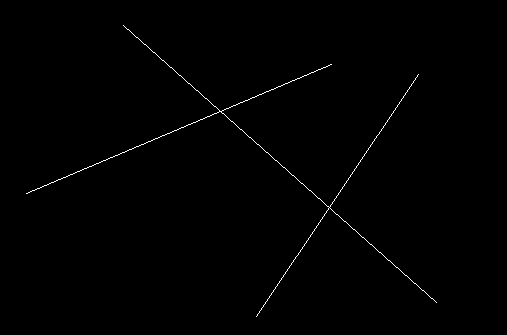
Applying the algorithm on the following input image with default parameters:
We obtain the following accumulation matrix...
... where the positions of the 3 white spots correspond to the properties of the 3 lines in the input image
Detection of lines from the accumulator matrix
Once the accumulation matrix is computed, detected lines correspond to the positions of pixels where the accumulation values are the highest in the matrix. A simple extraction of the local maxima in the accumulation matrix is then enough to deduce the properties of the detected lines. This extraction of local maxima is done with the Local Extrema Extraction 2d algorithm. Through the data item HoughLinesExtractionParams, the user can vary the following parameters of the local maxima extraction:
- accumulation threshold type (AccumThresholdType field), that determines the way to compute the accumulation threshold from the AccumThresholdValue field. Accumulation threshold is the value below which an element in the accumulation matrix cannot be considered as a local maximum. This attribute can take 3 different values:
- eHATT_Absolute: in this case, the threshold equals to the value specified by the user in the AccumThresholdValue field (described below)
- eHATT_MaxRatio (default value): in this case, the threshold equals to the maximal value in the accumulation matrix multiplied by the value of AccumThresholdValue field (that must then belong to the range [0;1])
- eHATT_HistoQuantile: in this last case, the threshold equals to the quantile of the histogram at the percentage specified in the AccumThresholdValue (that must belong to the range [0; 100] in that case)
- the value used to compute the accumulation threshold value (AccumThresholdValue field), depending on the chosen accumulation threshold type; its default values equals to 0.5
- minimum distance along each axis between 2 local maxima (LocalMaxSearchWindowRadius field); its default value equals to 1
Algorithm results
Once these 2 steps are done, the algorithm returns both the computed accumulation matrix and the collection of properties of detected lines (rho (in pixels), theta (in radians), and associated accumulation intensity). Please note that while rho value in accumulation matrix corresponds to the distance between line and center of image, rho values in the returned collection of properties of detected lines equal to the distance between lines and the origin of the image.
Typical use cases of this algorithm are:
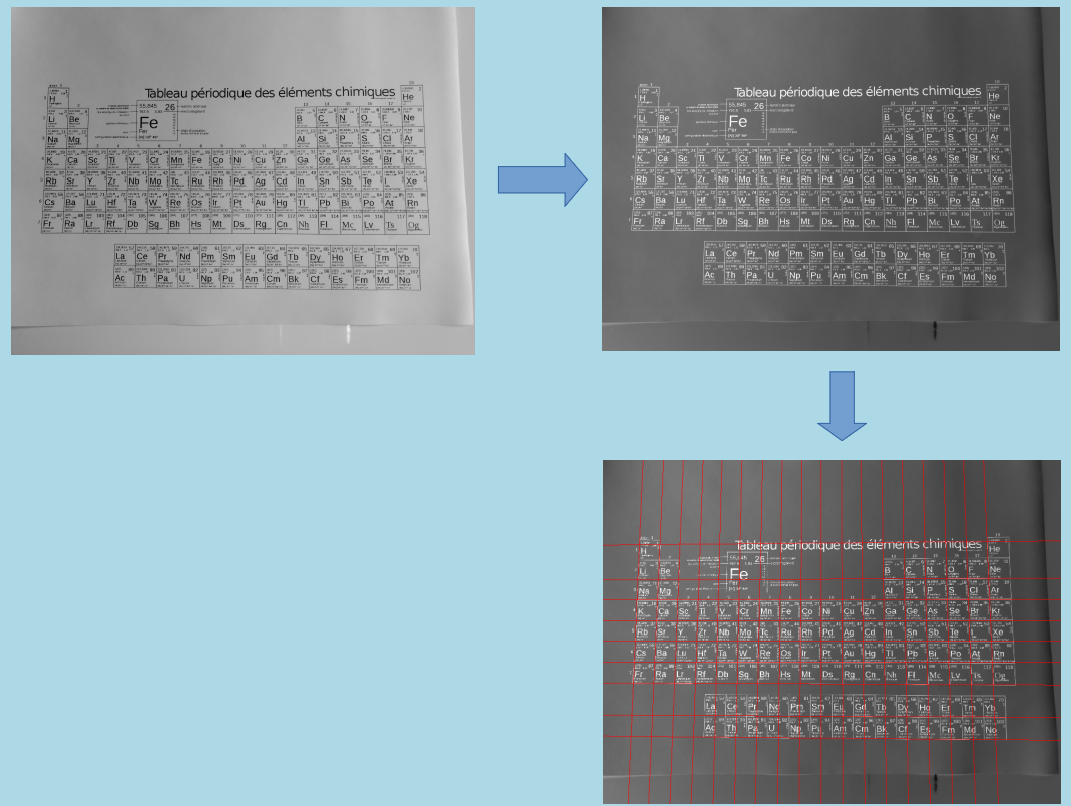
- pass the original grey-levels image as input of the algorithm, to detect bright lines on dark background. In example below (image 4608 x 3456, pixels encoded on unsigned chars), we would like to detect the borders of the cells of the table. First, we negate the input image, so that the dark borders on bright background become bright borders on dark background, and we pass the resulting image as input of our HoughLines2d algorithm, with following parameters: HoughLinesImgParams { RhoStep=2, ThetaMin=0, ThetaMax=
 , ThetaNbBins=720, IntensityTreshold=180 } and HoughLinesExtractionParams { AccumThresholdType=eHATT_MaxRatio, AccumThresholdValue=0.25, LocalMaxSearchWindowRadius=75 }. Detected lines are represented in red:
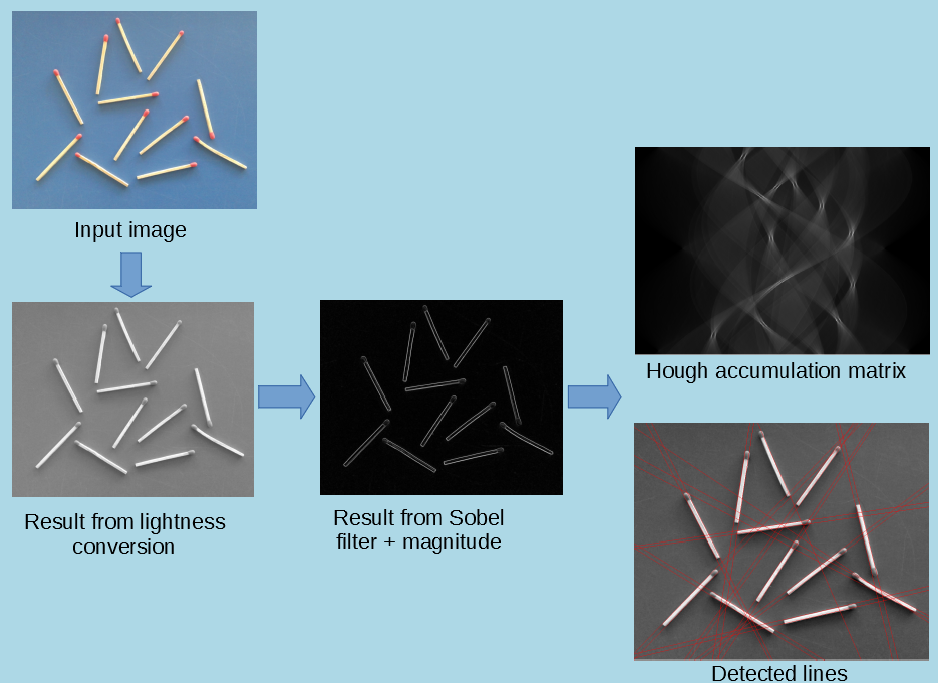
- compute the magnitude of gradient on the input grey-levels image, and pass the result as input of the HoughLines2d algorithm, to detect most significant straight-line edges. In the example below, we want to detect the lines corresponding to the borders of matches in the color image. First, we convert the input image in a grey-levels one, then we compute the gradient magnitude using a Sobel filter, and we pass the resulting image as input of HoughLines2d algorithm, with the following parameters: HoughLinesImgParams { RhoStep=1, ThetaMin=0, ThetaMax= , ThetaNbBins=360, IntensityTreshold=0 } and HoughLinesExtractionParams { AccumThresholdType=eHATT_MaxRatio, AccumThresholdValue=0.5, LocalMaxSearchWindowRadius=7 }.
- delegate the extraction of edges to a dedicated algorithm (CannyEdges2dImg, for instance), and pass the result as input of the HoughLines2d algorithm; this last solution may be a good alternative if, for any reason, using the second solution (apply the detector on the image of gradient magnitude) does not give results satisfying enough (if the magnitude of gradients along straight-lined edges varies too much, for instance)
- See also
- HoughLinesGradient2d is an extension of current algorithm, that could be a good alternative when the detection of edges of thing straight-lined stripes is required, in particular.
Example of Python code :
Example imports
import PyIPSDK
import PyIPSDK.IPSDKIPLFeatureDetection as fd
import PyIPSDK.IPSDKIPLFiltering as filter
Code Example
inImg = PyIPSDK.loadTiffImageFile(inputImgPath)
rhoStep = 2.0
thetaRange = PyIPSDK.createEvenlySpacedRange(math.pi/2, 3*math.pi/4, 15)
intensityThreshold = 210.0
imgParams = PyIPSDK.createHoughLinesImgParams(
rhoStep, thetaRange, intensityThreshold)
extractionParams = PyIPSDK.createDefaultHoughLinesExtractionParams()
outLines, outImg = fd.houghLines2d(
inImg, imgParams, extractionParams)
Example of C++ code :
Example informations
Header file
#include <IPSDKIPL/IPSDKIPLFeatureDetection/Processor/HoughLines2d/HoughLines2d.h>
Code Example
const ipReal64 rhoStep = 1.0;
M_PI / 2, 3 * M_PI / 4, 15);
const EvenlySpacedRange& thetaRange = *pThetaRange;
const ipReal32 intensityThreshold = 10.0f;
rhoStep, thetaRange, intensityThreshold);
const ipReal64 accumTresholdValue = 0.5f;
const ipUInt32 localMaxSearchWindowRadius = 10;
accumThresholdType, accumTresholdValue, localMaxSearchWindowRadius);
HoughLinesResult res = houghLines2d(
pInImg, pInHoughImgPrms, pInHoughExtractPrms);
const ImagePtr pAccumulationMatrix = res._pOutImg;